Air Quality (AQI) Now Available
/The Instant Weather app provides Air Quality Index (AQI) information to help you understand current air quality conditions and how they may change over time.
You can check current AQI readings, explore hourly forecasts, view interactive air quality maps and learn about individual air pollutants.
Available in version 2.3.141 and later for iOS and Android.
Quick Start: Check Air Quality in Instant Weather
Instant Weather lets you check current air quality, view hourly forecasts and explore air quality conditions on a map.
1. Check Current Air Quality
On the Weather page, tap More Details beneath the temperature.
Find the colour-coded Air Quality (AQI) value and tap it to see detailed information, including the closest monitoring station and individual pollutants.
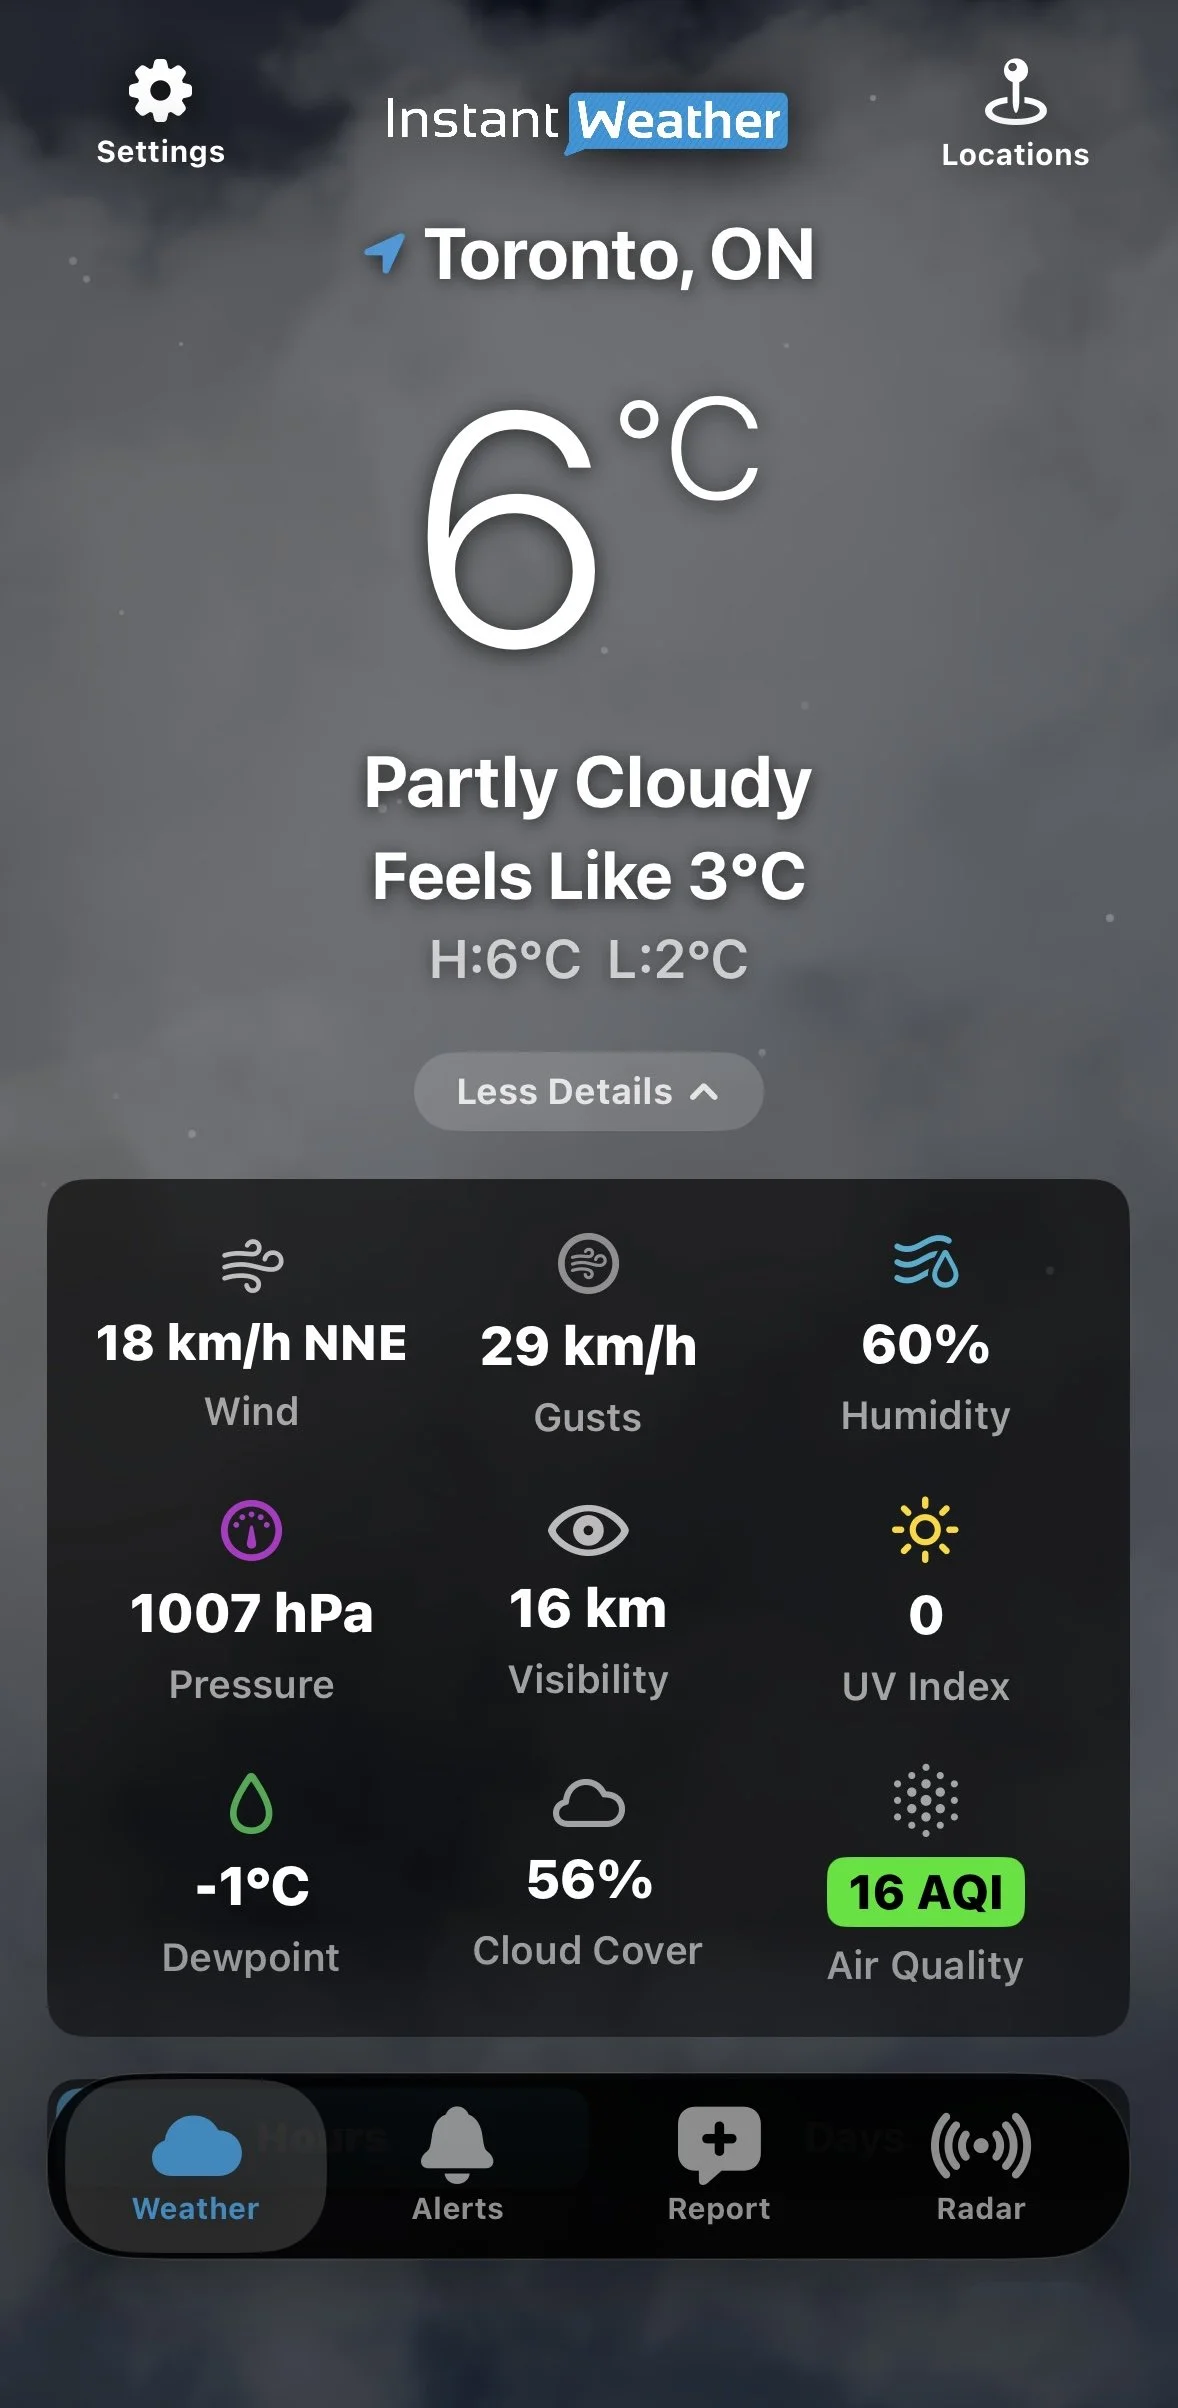
Current Air Quality
2. View the Hourly AQI Forecast
Scroll down to Hours and tap Details and more products beneath the hourly forecast. You can also tap an individual hourly forecast period to expand its details.
Tap Air Quality to display the Estimated AQI graph.
Scroll through the hourly forecast to see how air quality is expected to change. The graph changes colour as AQI levels rise or fall.
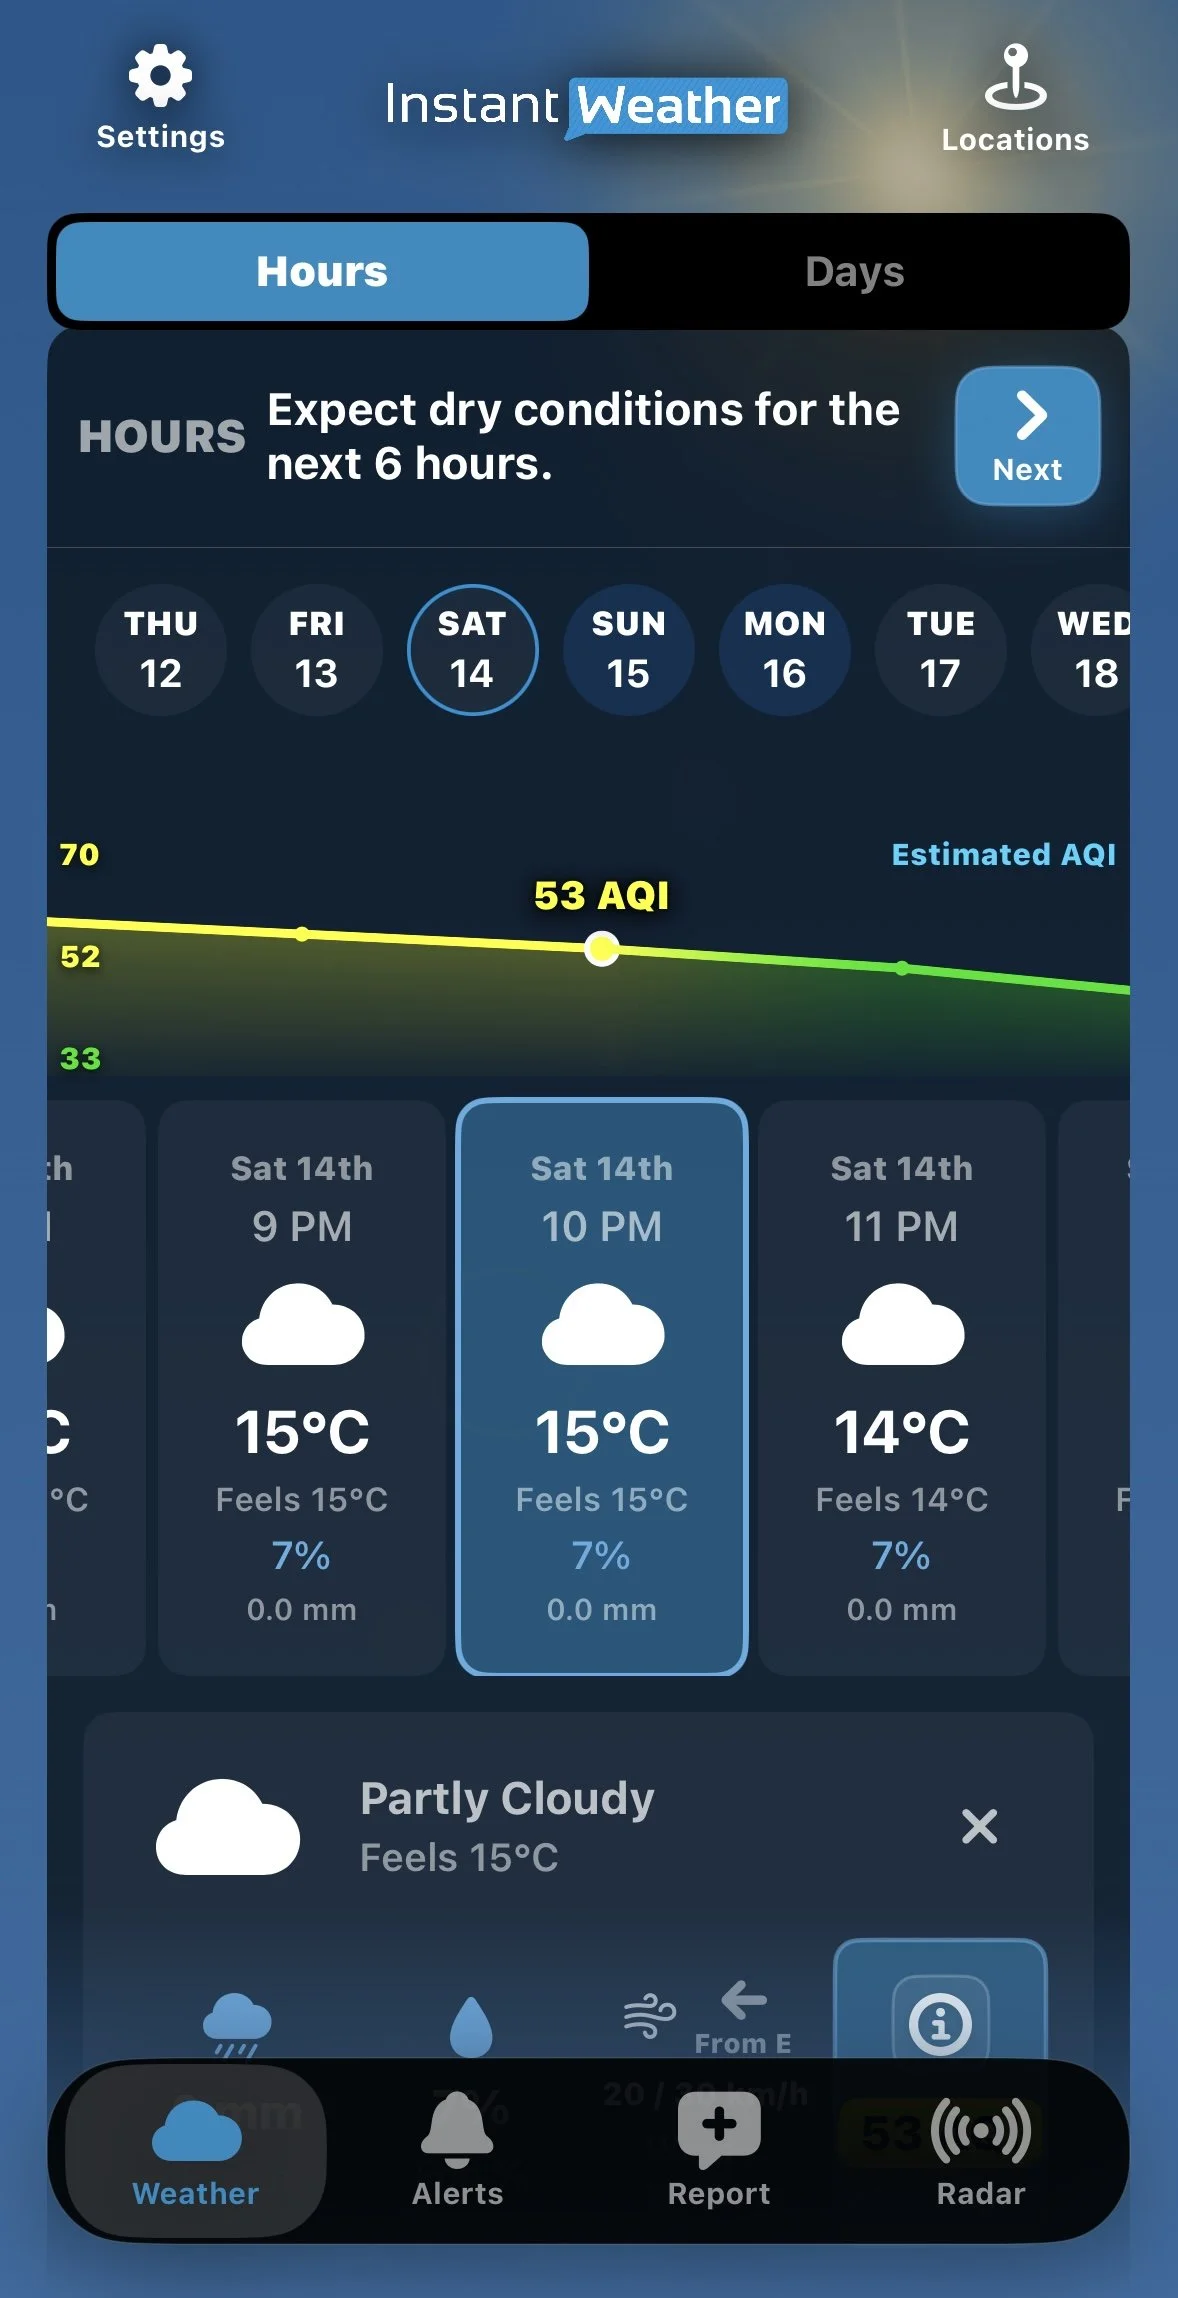
Hourly AQI Graph
3. Explore the Air Quality Map
Tap an Air Quality value to open the detailed view, then tap the expand icon on the map.
You can explore air quality in surrounding areas, move through the forecast timeline or tap Play to animate changes.
Playback speeds of 1x, 2x and 4x are available.
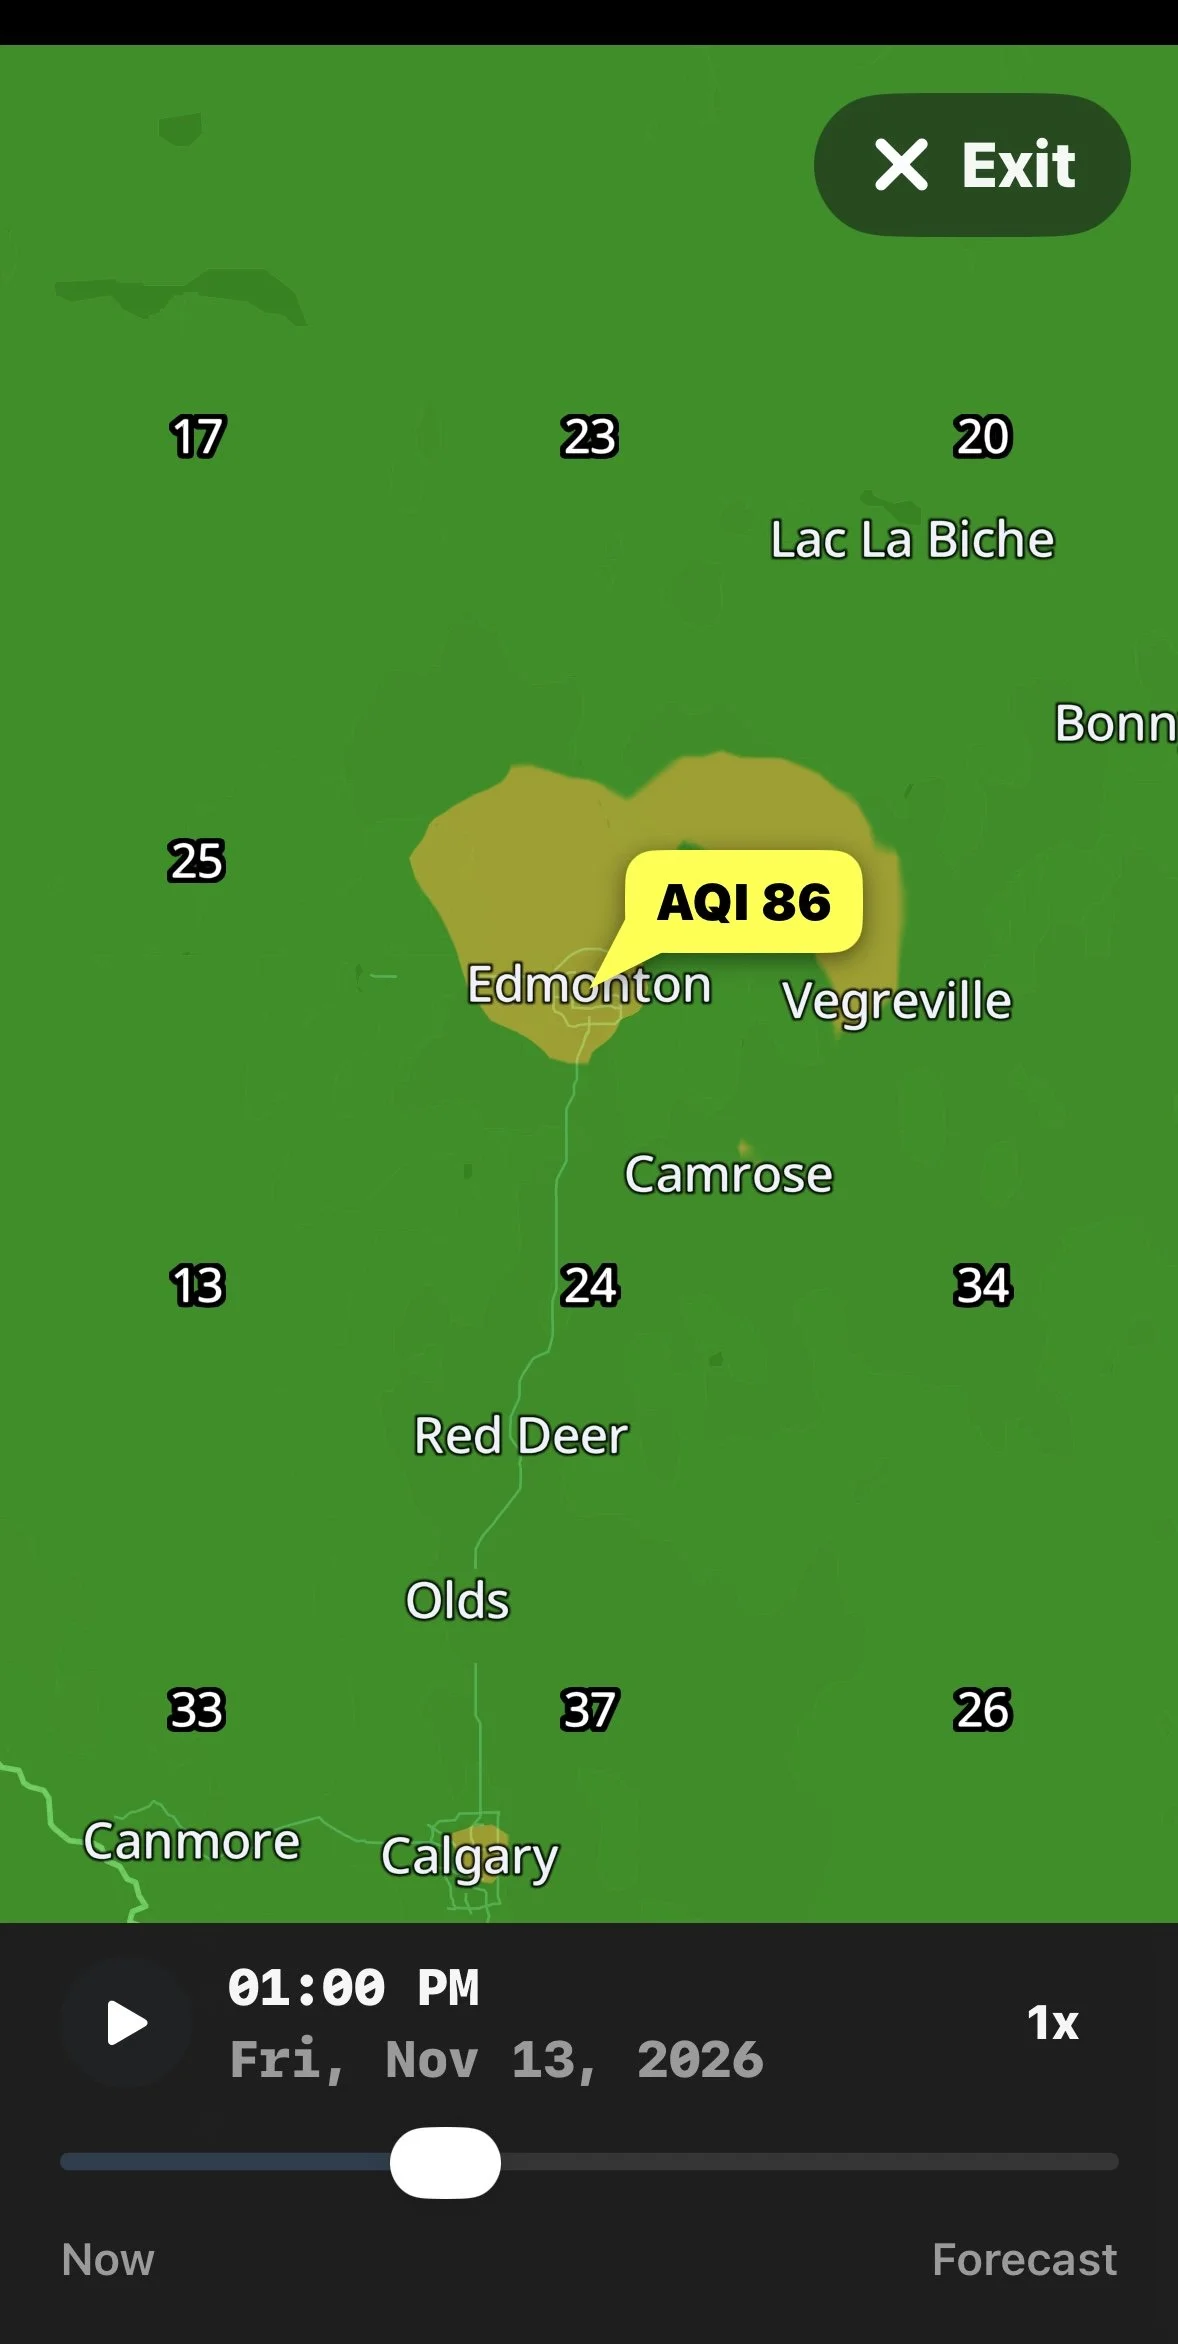
Expanded Air Quality Map
Want to learn more? Continue reading for explanations of AQI colours and categories, air pollutants, monitoring stations, forecasts and map features.
Understanding the Air Quality Index (AQI)
The Air Quality Index is a numerical scale used to communicate air quality conditions and their potential health effects.
Lower AQI values indicate better air quality, while higher values indicate increasing levels of air pollution and potentially greater health concerns.
Instant Weather uses the following colour-coded AQI scale:
| AQI | Category | Colour |
|---|---|---|
| 0–50 | Good | Green |
| 51–100 | Moderate | Yellow |
| 101–150 | Unhealthy for Sensitive Groups | Orange |
| 151–200 | Unhealthy | Red |
| 201–300 | Very Unhealthy | Purple |
| 301+ | Hazardous | Maroon |
What Do the AQI Categories Mean?
Good (0–50)
Air quality is satisfactory, and air pollution poses little or no risk.
Moderate (51–100)
Air quality is acceptable, although some people who are unusually sensitive to air pollution may experience effects.
Unhealthy for Sensitive Groups (101–150)
People who are more sensitive to air pollution, including those with certain heart or lung conditions, may experience health effects.
Unhealthy (151–200)
Some members of the general public may experience health effects, while sensitive individuals may experience more serious effects.
Very Unhealthy (201–300)
Health alert conditions. The risk of health effects is increased for everyone.
Hazardous (301+)
Health warning of emergency conditions. Everyone is more likely to be affected.
For Canadian users: Instant Weather displays the AQI scale shown above, which is different from Canada's Air Quality Health Index (AQHI). The AQHI generally uses a scale from 1 to 10+ to communicate health risks associated with air pollution. The two scales should not be compared directly.
Viewing Current Air Quality Conditions
The current AQI reading appears in the expanded weather details on the Weather page.
Tap the Air Quality reading to open the detailed Air Quality window.
Understanding Current Observations
When current air quality observations are available, the detailed view may include:
The current AQI value and category.
The closest air quality monitoring station.
The distance to the monitoring station.
The date and time of the observation.
A map showing the monitoring station and surrounding area.
Information about individual air pollutants.
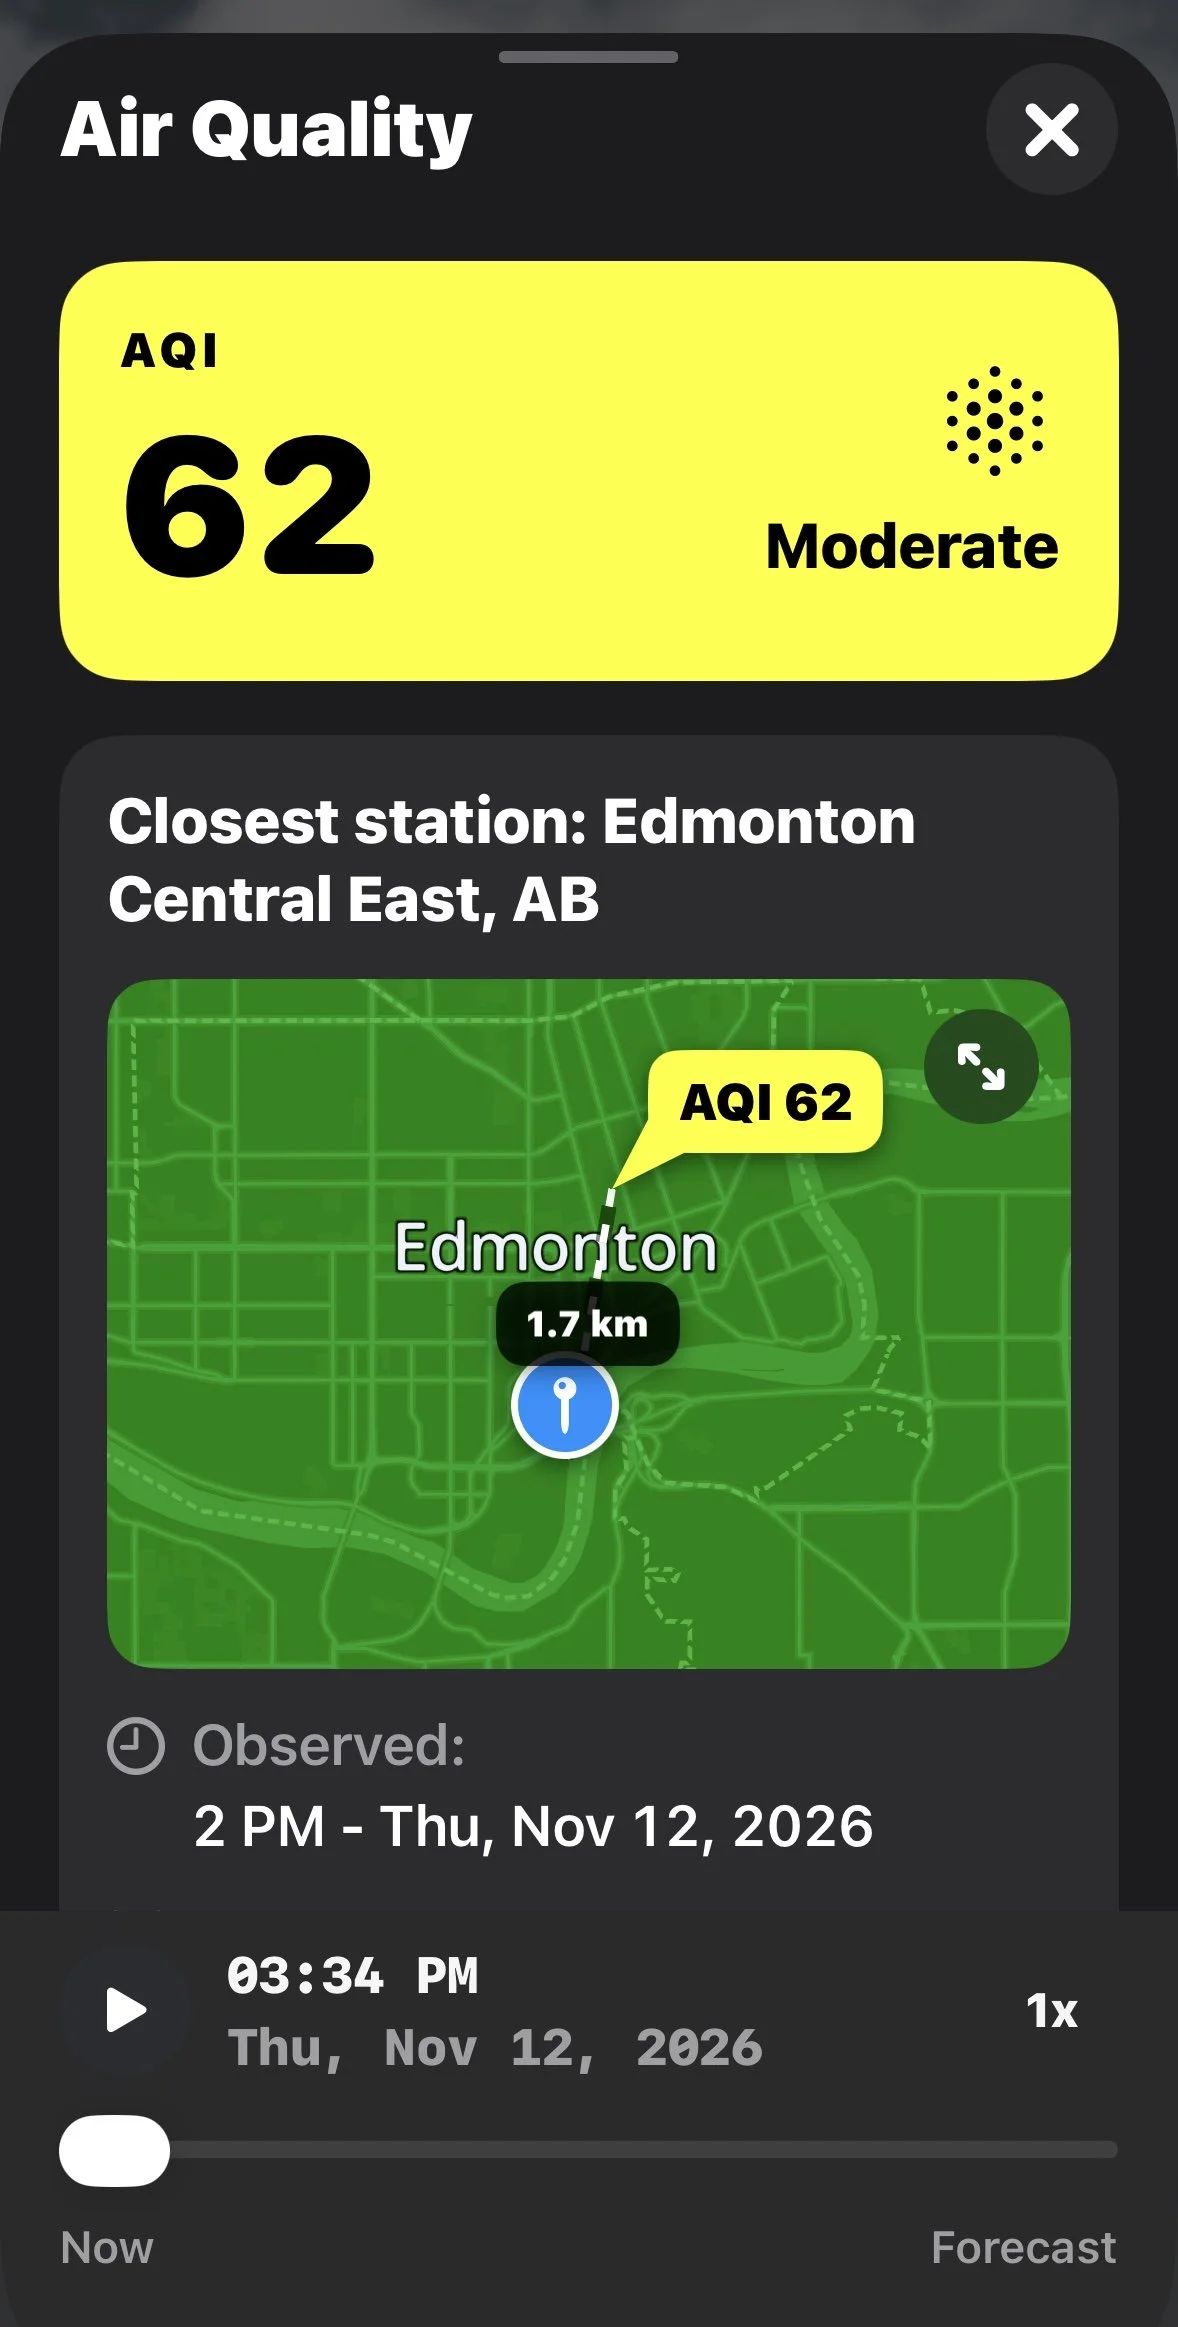
Current Air Quality Observation
Air quality monitoring stations are not located in every community. The closest available observation may come from a station some distance away.
Because air quality can vary geographically, the reading may not represent the exact conditions at your location.
Why Does Air Quality Sometimes Show "Data Unavailable"?
Current AQI readings depend on the availability of recent observations from monitoring stations.
If no recent station observation is available near the selected location, the app may display Data unavailable.
For example, the app may indicate that no recent station observation was found within 100 km.
This does not necessarily mean forecast information is unavailable. You may still be able to explore future air quality conditions using the forecast timeline.
Viewing Hourly Air Quality Forecasts
Instant Weather provides estimated air quality information for upcoming forecast periods.
How to View the AQI Graph
Open the Hours section of the Weather page.
Tap Details and more products beneath the hourly forecast, or tap an individual forecast period.
Select Air Quality in the expanded details.
The graph will display Estimated AQI.
Scroll horizontally through the forecast periods to explore changing conditions.
The selected forecast period is highlighted, and its estimated AQI value appears on the graph.
Understanding the Colour-Changing Graph
The AQI graph uses colours corresponding to the air quality categories described above.
As forecast values increase or decrease, the graph changes colour to reflect the expected air quality conditions.
This makes it easier to identify periods when air quality may improve or deteriorate without examining every individual value.
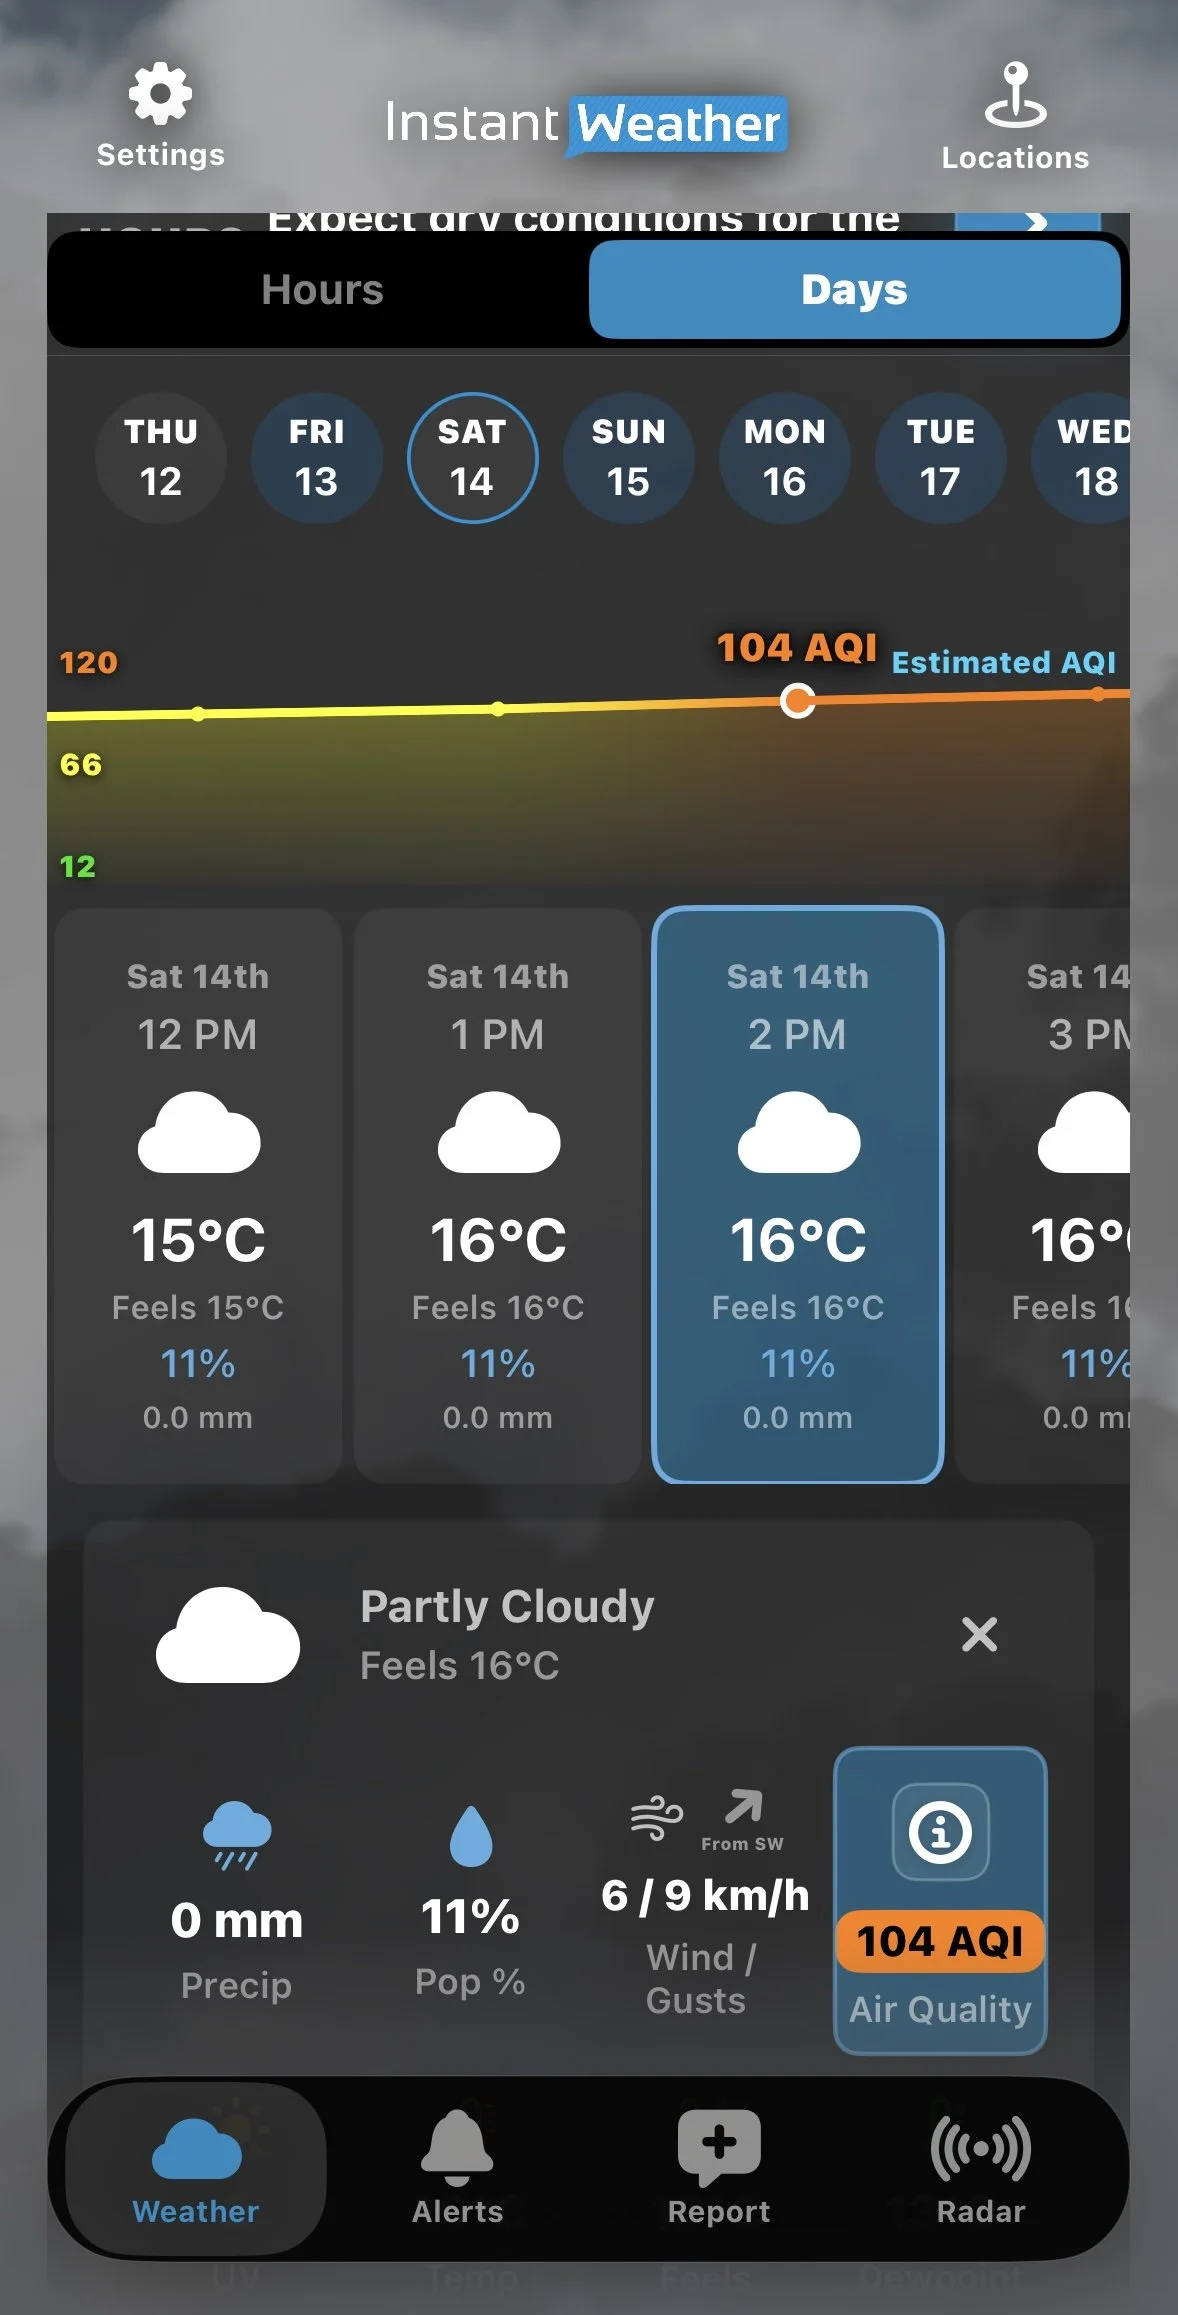
Higher AQI Forecast
The graph displays Estimated AQI because these values are forecasts rather than actual observations.
You can also scroll through the forecast to explore later periods.
Exploring the Interactive Air Quality Map
The Air Quality map provides a visual representation of air quality conditions across a region.
It can be particularly useful during wildfire smoke events or when pollution affects some communities more than others.
Opening the Map
Tap an Air Quality reading in the current conditions or hourly forecast details.
The detailed Air Quality window will open.
Find the map showing the monitoring station or forecast location.
Tap the expand icon in the upper-right corner to open a larger map.
Understanding the Map
The map uses colours corresponding to AQI categories.
For example, areas with Good air quality may appear green, while areas experiencing Moderate conditions may appear yellow.
Numerical AQI values may also appear at different locations on the map.
You can explore surrounding areas to compare air quality conditions between communities.
Viewing Future Air Quality Conditions
Instant Weather provides air quality forecasts extending approximately three days into the future.
The detailed Air Quality window includes a timeline and playback controls.
You can:
Move the timeline slider to select a different forecast time.
Tap Play to animate changes in air quality over time.
Adjust the playback speed to 1x, 2x or 4x.
Expand the map to explore conditions across a larger area.
As you move through the forecast, the map changes to reflect the predicted conditions for the selected time.
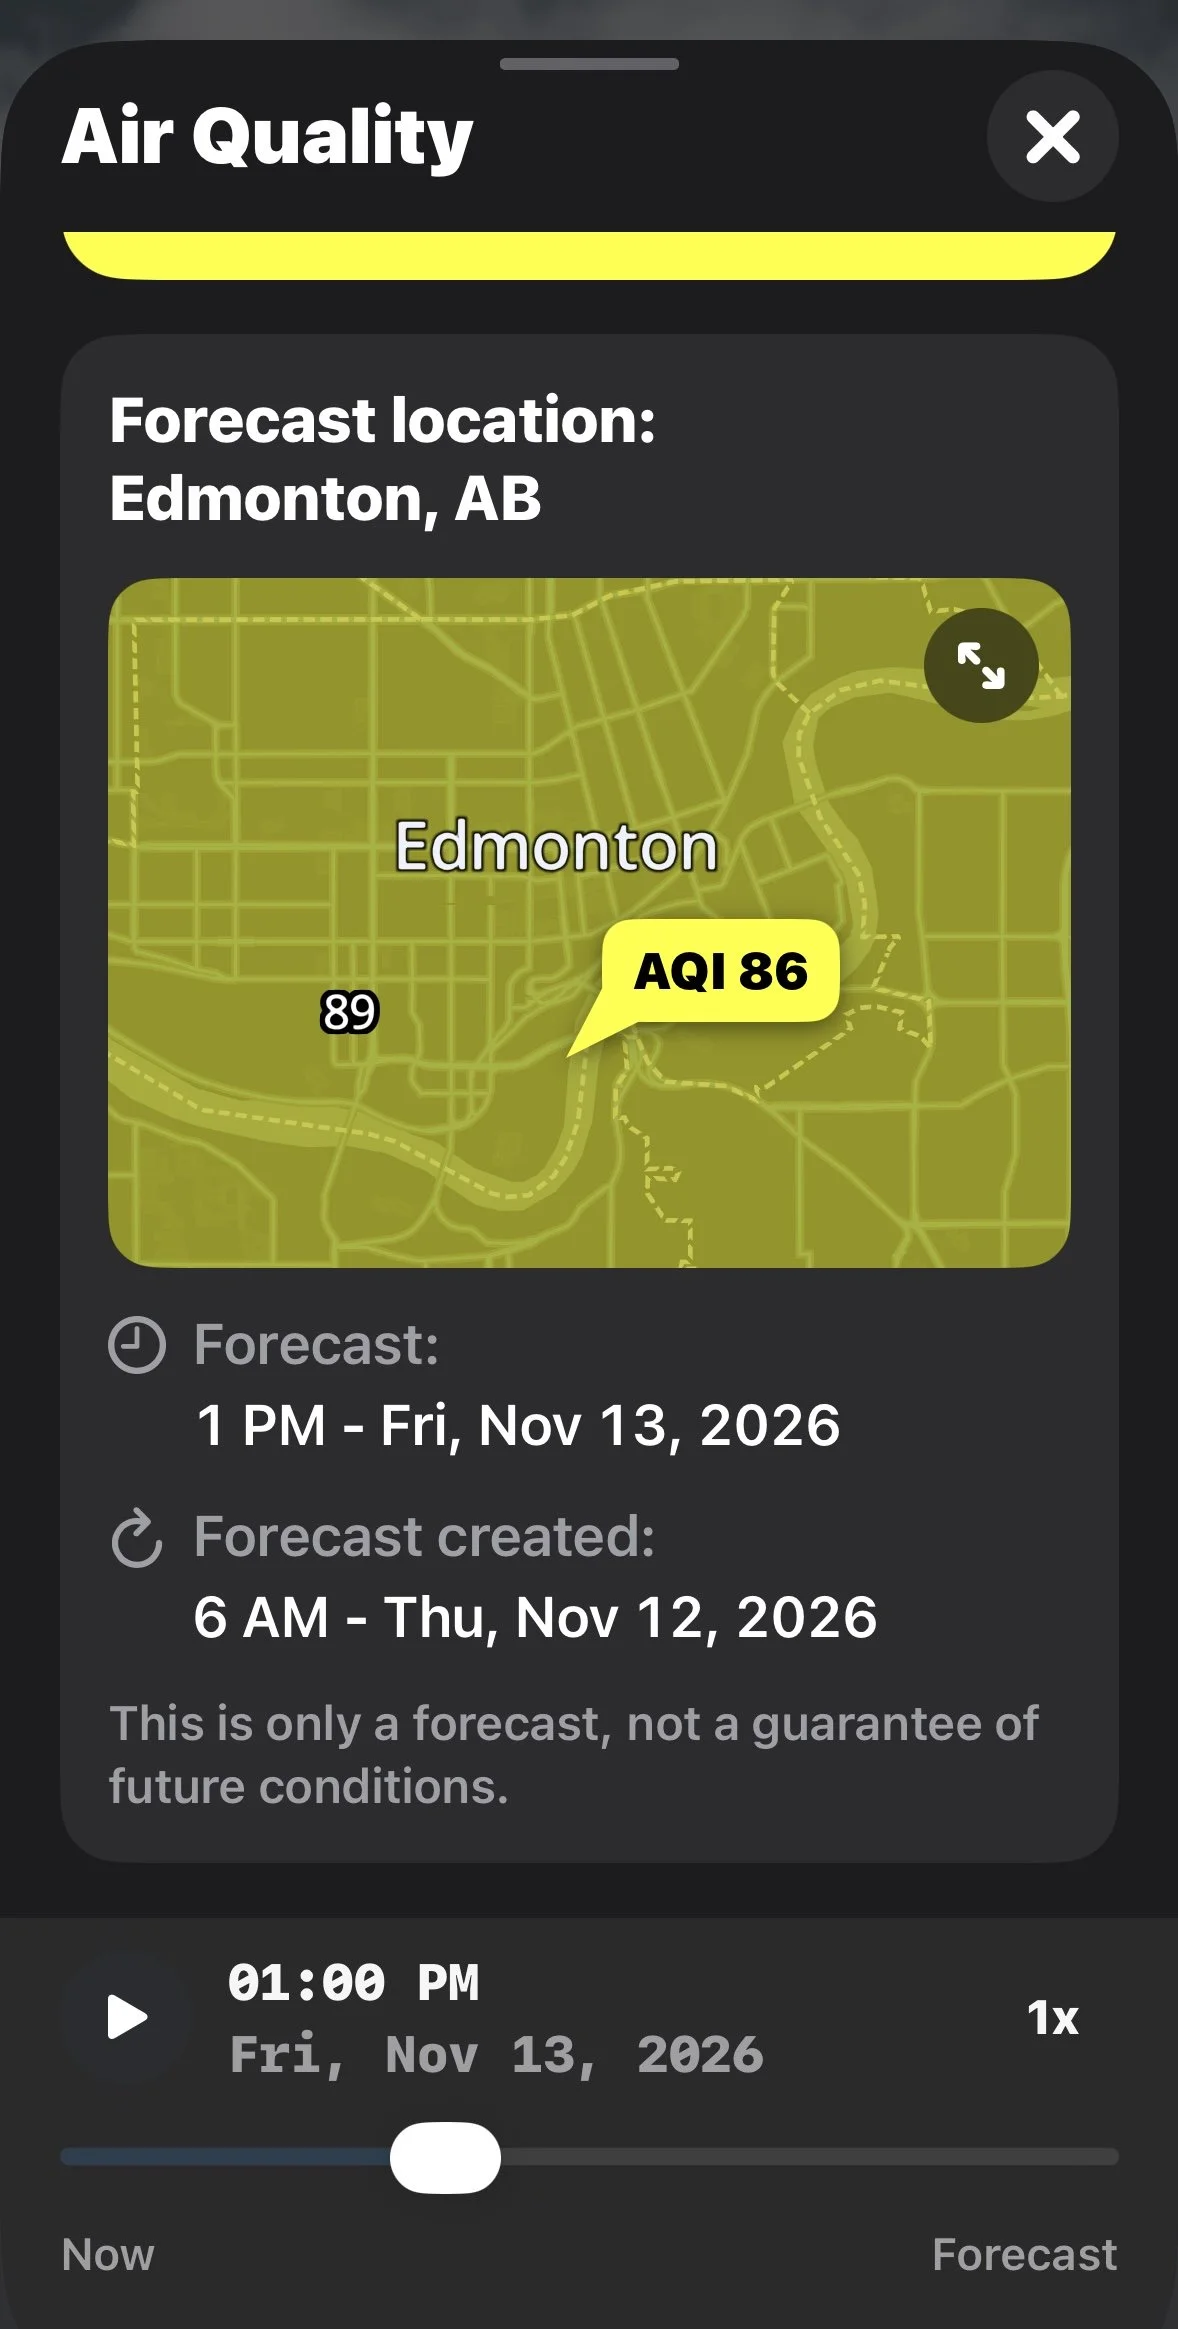
Air Quality Forecast Details
Forecasts can help you plan outdoor activities, but actual air quality conditions may differ from predictions.
Understanding Individual Air Pollutants
The detailed Air Quality window also provides information about individual pollutants that can affect air quality.
Instant Weather displays information for three pollutants.
PM2.5: Fine Particulate Matter
PM2.5 consists of extremely small airborne particles with diameters of 2.5 micrometres or less.
Sources include wildfire smoke, vehicle emissions, industrial activities and other forms of combustion.
These particles can travel deep into the lungs and may affect respiratory and cardiovascular health.
PM2.5 concentrations are displayed in µg/m³ (micrograms per cubic metre).
NO₂: Nitrogen Dioxide
Nitrogen dioxide is a gas produced primarily by burning fuel.
Common sources include vehicle exhaust, industrial processes and power generation.
Elevated concentrations can irritate the respiratory system, particularly for people with asthma or other respiratory conditions.
NO₂ concentrations are displayed in ppb (parts per billion).
Ozone: Ground-Level Ozone
Ground-level ozone forms when certain pollutants react in sunlight.
Higher concentrations can irritate the respiratory system and contribute to breathing difficulties.
Ground-level ozone is different from the protective ozone layer high in the atmosphere.
Ozone concentrations are displayed in ppb (parts per billion).
How Do These Pollutants Affect the AQI?
Instant Weather states that its AQI is estimated using the highest score among PM2.5, nitrogen dioxide and ground-level ozone.
Tap the information icon beside an individual pollutant in the app to learn more about it.
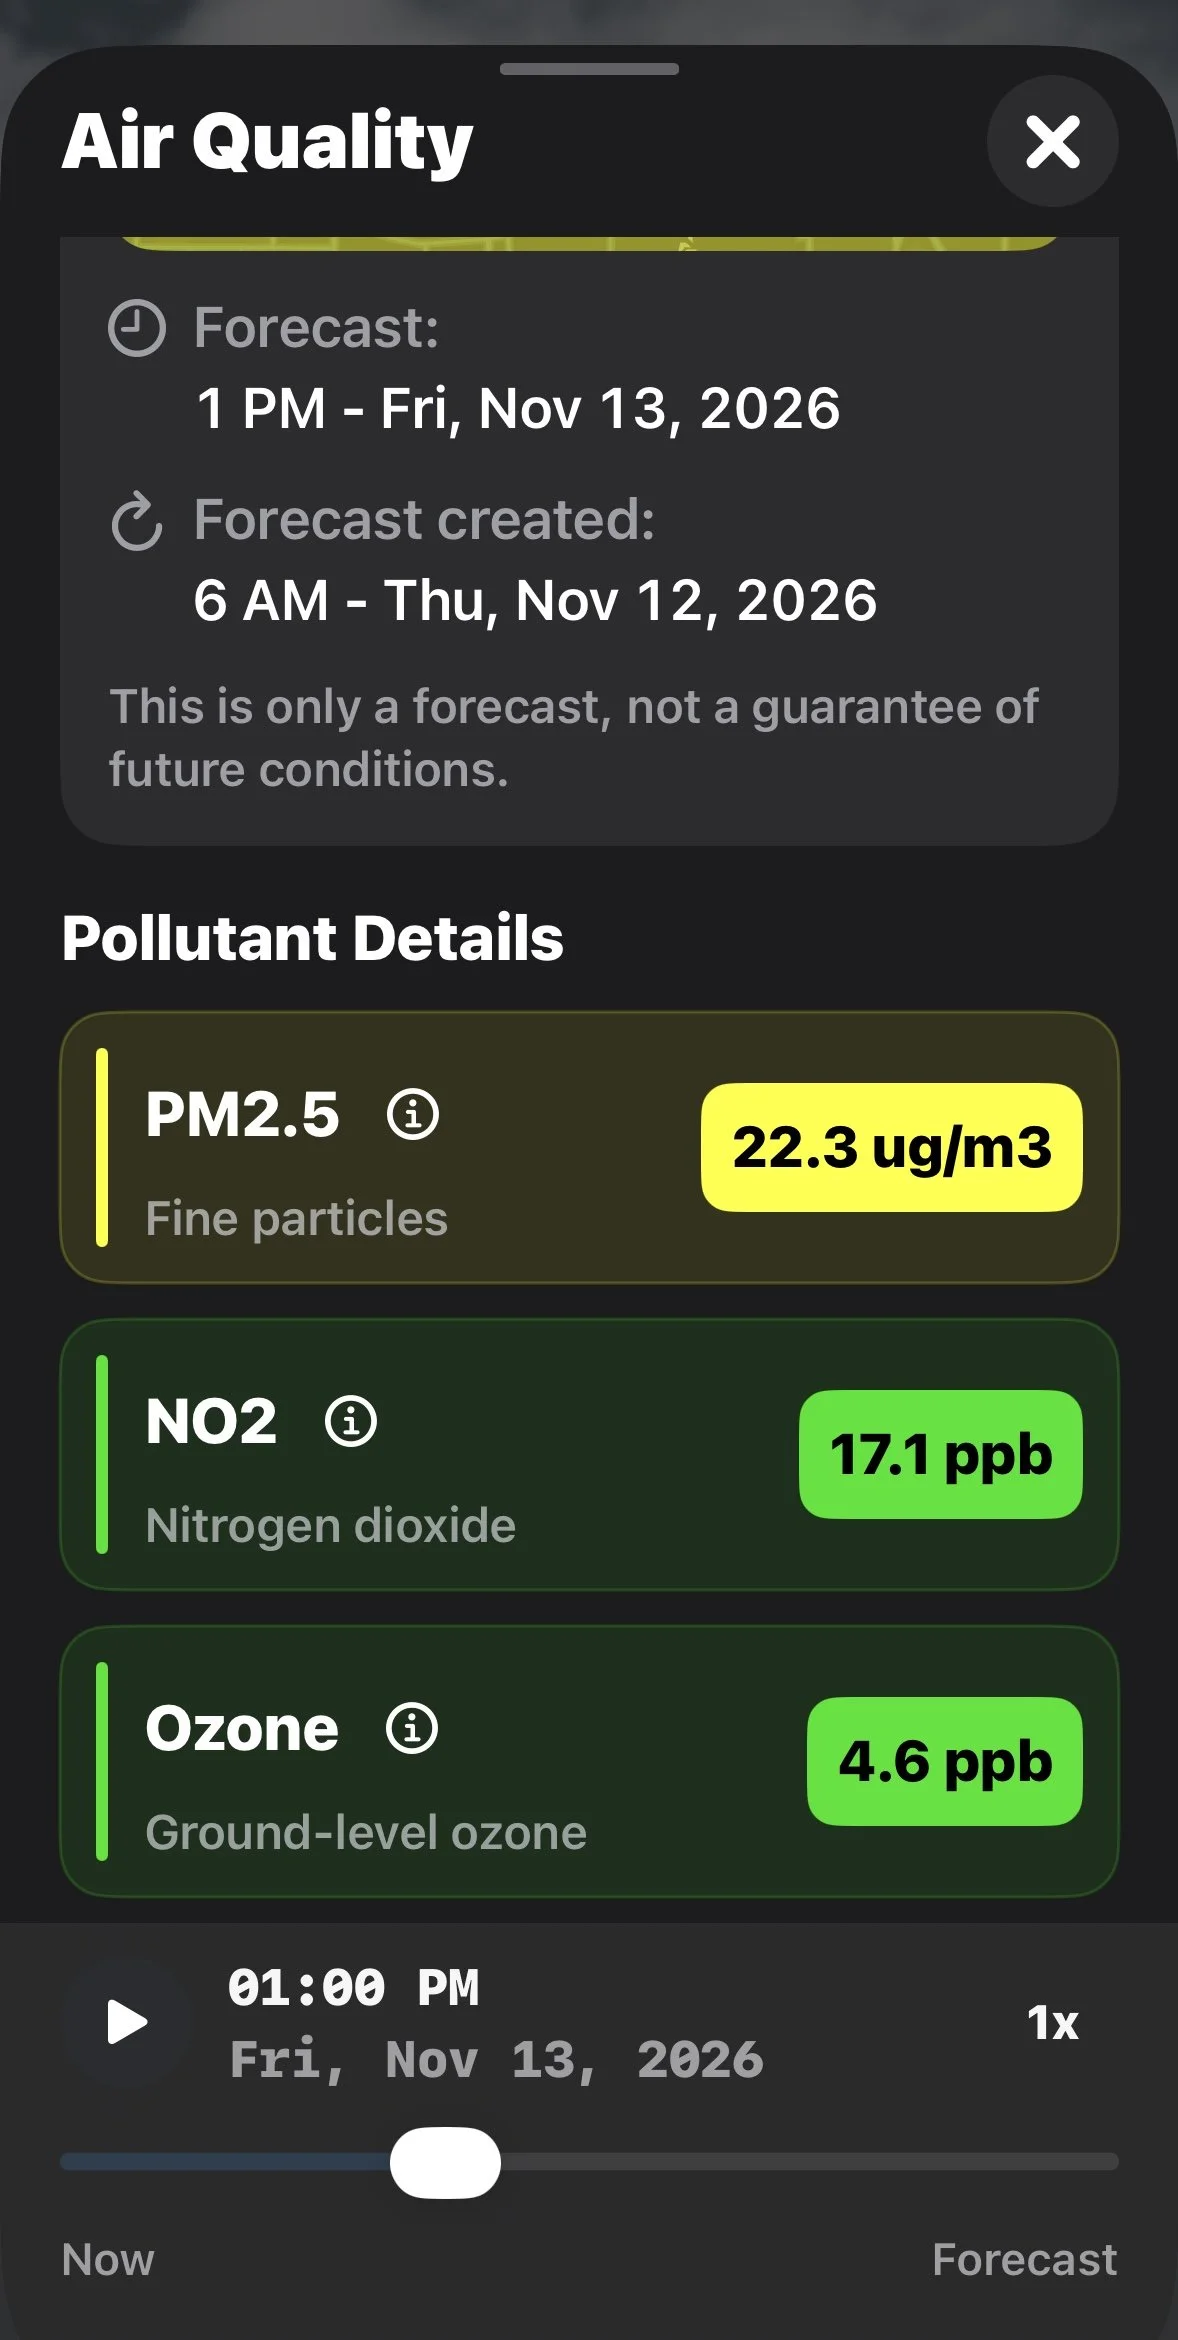
Pollutant Details
Observed Air Quality vs. Forecast Air Quality
There are two types of air quality information available in the app.
Observed Air Quality
Observed readings are based on measurements collected by air quality monitoring stations.
When available, the app identifies the closest monitoring station, its distance from your selected location and the time of the observation.
Forecast Air Quality
Forecast values are estimates of future air quality conditions.
The app displays the forecast location, the time being forecast and when the forecast was created.
Forecasts can help you plan outdoor activities, but actual conditions may differ from predictions.
Frequently Asked Questions
Why Is the AQI Different From Canada's AQHI?
The Air Quality Index (AQI) and Canada's Air Quality Health Index (AQHI) use different scales and methods.
Instant Weather displays AQI values ranging from Good (0–50) to Hazardous (301+).
Canada's AQHI generally uses a scale of 1 to 10+ and is designed to communicate health risks associated with air pollution.
The numerical values from these two systems should not be compared directly.
Why Is My Air Quality Reading From Another Community?
Air quality observations are collected at monitoring stations, which may not be located in every community.
The app identifies the closest available monitoring station and may display its distance from your selected location.
Why Does the AQI Graph Change Colour?
The graph uses colours corresponding to air quality categories.
As forecast values increase or decrease, the colours help illustrate changes in air quality conditions.
Why Does the Forecast AQI Differ From the Current Reading?
Current readings are based on observations, while forecast values are estimates of future conditions.
Differences can occur because of changing weather conditions, pollution sources, forecast uncertainty and the location of monitoring stations.
Can I View Air Quality in Other Communities?
Yes. You can select another location in Instant Weather to view available air quality information.
You can also explore the expanded Air Quality map to examine conditions across a larger geographic area.
How Accurate Are Air Quality Forecasts?
Air quality forecasts are estimates based on available information and forecast models.
Actual conditions may differ, particularly when air quality changes rapidly due to wildfire smoke or other pollution sources.
Why Monitoring Air Quality Matters
Air quality can change due to wildfire smoke, vehicle emissions, industrial pollution and weather conditions.
Poor air quality can affect anyone, but children, older adults and people with heart or lung conditions may be particularly sensitive.
Checking current conditions and upcoming forecasts can help you make informed decisions about outdoor activities.
During periods of poor air quality, follow recommendations from your local public health authorities.
Last updated: November 12, 2026