Understanding Weather Fronts in IW Pro

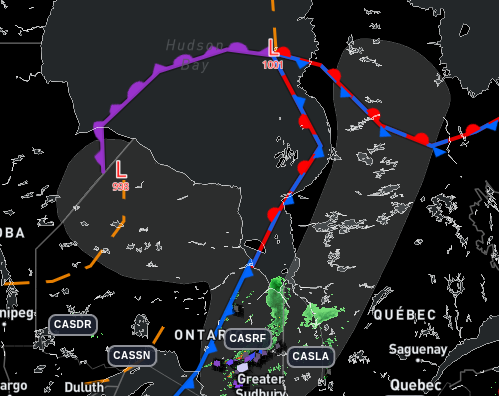
Have you noticed the coloured lines, triangles, semicircles and H and L symbols on the IW Pro radar?

The Weather Fronts feature adds information from traditional surface weather maps directly to the IW Pro radar. This can help you understand the larger weather pattern behind what you are seeing on radar, not just where rain or snow is occurring, but some of the atmospheric features helping to produce that weather.

Turning Weather Fronts On or Off

Weather Fronts can be enabled or disabled at any time.

Open Settings, expand the Weather Features section and use the Weather Fronts toggle to turn the layer on or off.
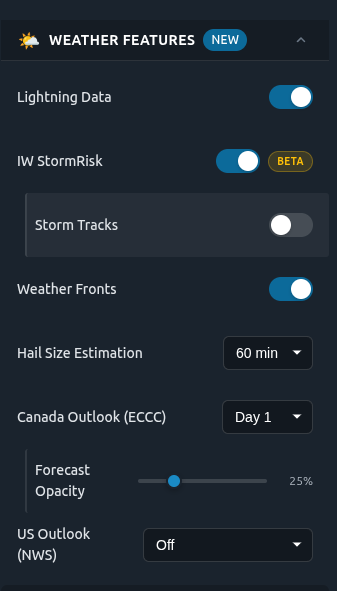
Once enabled the fronts and pressure systems will appear on the radar map.

Where Does the Weather Front Information Come From?

The fronts displayed in IW Pro are official fronts from the U.S. Weather Prediction Center (WPC).

The information is updated every three hours.

This is important to keep in mind when using the radar animation. The precipitation on the radar can move while the plotted weather fronts remain in the same position. The fronts are not currently animated continuously between WPC updates.

For example, if you play the radar loop, you might see an area of rain or thunderstorms moving eastward while a nearby cold front appears to remain stationary on the map. That doesn't necessarily mean the front itself isn't moving. It means that the position of the front shown on the map is based on the latest available WPC update.

We would eventually like to make this feature more dynamic by automatically moving the fronts between official updates using weather-station observations.

How to Read the Weather Fronts Map

The Weather Fronts layer uses the familiar symbols found on traditional surface weather maps. Understanding a few basic symbols can tell you quite a bit about the weather pattern.

🔵 Cold Front

A cold front is displayed as a blue line with blue triangles.

A cold front marks the leading edge of an advancing colder air mass. The triangles point in the direction the front is moving.

Cold fronts can be associated with showers and thunderstorms, particularly when warm and humid air is present ahead of the front. Temperatures and humidity often decrease following its passage.

🔴 Warm Front

A warm front is displayed as a red line with red semicircles.

It represents the leading edge of an advancing warmer air mass. The semicircles point in the direction the front is moving.

Warm fronts are often associated with increasing cloud cover and areas of precipitation ahead of the front, followed by warmer conditions after it passes.

🔴🔵 Stationary Front

A stationary front is shown using alternating red semicircles and blue triangles on opposite sides of the line.

This represents a boundary between two air masses that is moving very little or not at all.

Because a stationary front can remain over the same area for an extended period, it can sometimes contribute to prolonged cloud cover or precipitation.

🟣 Occluded Front

An occluded front is displayed as a purple line with alternating triangles and semicircles on the same side.

Occlusion occurs when a cold front catches up with a warm front. These systems are commonly associated with mature low-pressure systems and can produce widespread cloud and precipitation.

As with cold and warm fronts, the symbols point in the direction the front is moving.

High and Low Pressure Systems

Weather Fronts also lets you see the locations of high- and low-pressure systems.

🔵 H High Pressure

A blue H marks the centre of an area of relatively high atmospheric pressure.

High-pressure systems are often associated with quieter and clearer weather, although the actual conditions depend on the season and overall weather pattern.

🔴 L Low Pressure

A red L marks the centre of an area of relatively low atmospheric pressure.

Low-pressure systems are frequently associated with clouds, precipitation and more unsettled weather. Warm fronts, cold fronts and occluded fronts are commonly connected to low-pressure systems.

A pressure value may also be displayed near the H or L, indicating the atmospheric pressure near the centre of the system in millibars (mb).

What Are the Orange Lines?

You may also notice orange lines on the map.

These can represent troughs, which are elongated areas of relatively low atmospheric pressure.

Unlike a cold or warm front, a trough doesn't necessarily separate two distinct air masses. However, troughs can still be important areas for rising air, cloud development, precipitation and thunderstorms.

Putting It All Together

One of the advantages of displaying Weather Fronts on the IW Pro radar is being able to compare the larger weather pattern with what is actually happening on radar.
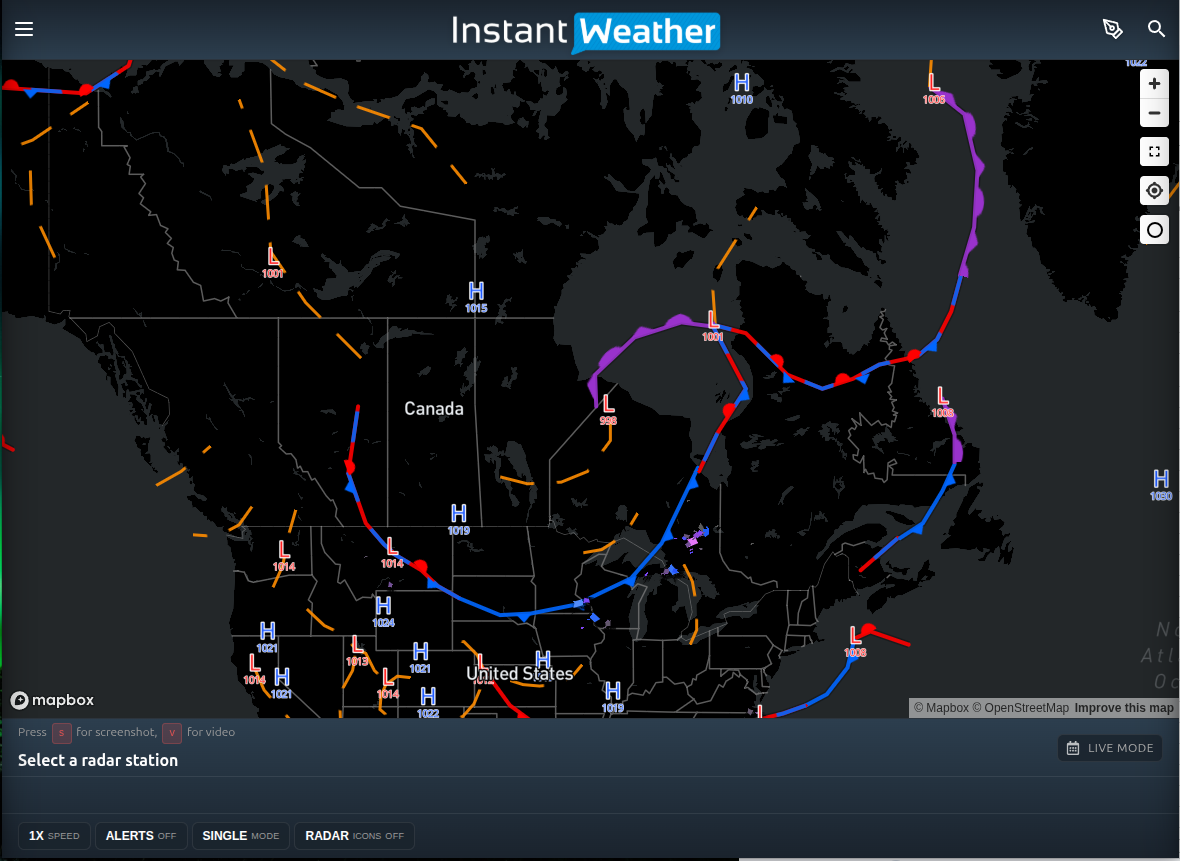
Weather Fronts in IW Pro

For example, you might be able to see:

  • a line of thunderstorms developing along or ahead of a cold front;

  • an area of steady precipitation associated with a warm front;

  • precipitation wrapping around a low-pressure system;

  • showers or thunderstorms developing near a trough; or

  • relatively quiet weather underneath an area of high pressure.

The radar shows you where precipitation is occurring, while the Weather Fronts layer provides additional information that can help explain why the weather pattern looks the way it does.

Combine Weather Fronts With Other IW Pro Layers

You can view Weather Fronts on a relatively uncluttered map by turning off other layers as above or combine them with other information available in IW Pro.
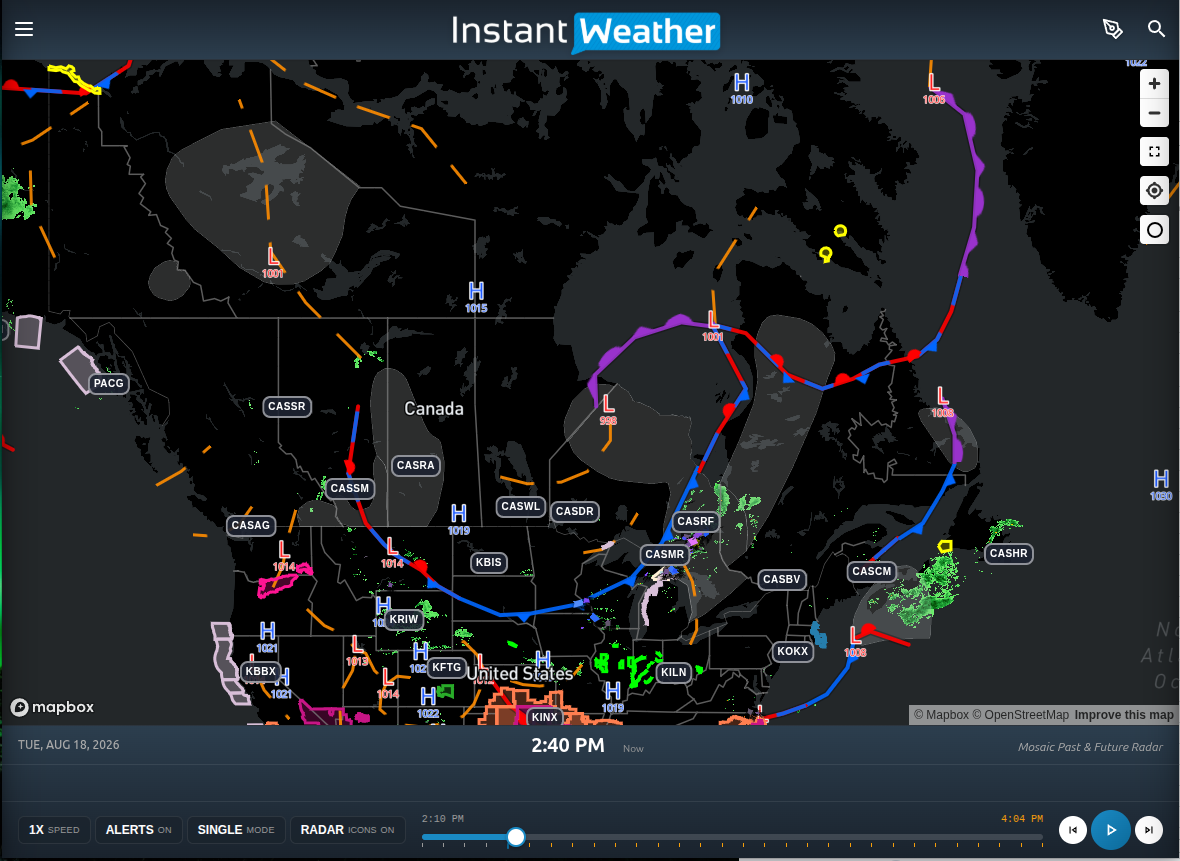
For example, you can display radar information, alerts and radar station information at the same time. Alternatively, turning some of those layers off can make it easier to focus specifically on the fronts and pressure systems.

Experiment with the different layers to find the combination that gives you the information you want without making the map too busy.

A Note About Timing

Because the fronts are updated every three hours rather than moving continuously, don't use their exact plotted position as a minute-by-minute indication of where a front is located.

The triangles and semicircles indicate the direction a front is moving, but the front itself will remain at its plotted position in IW Pro until updated information is received.

This is why you may occasionally notice that the precipitation has moved relative to a front while you are watching the radar.

Learn More About Weather Maps

For more information about fronts, pressure systems and the other symbols used on surface weather maps, NOAA's JetStream weather education site has a helpful guide.

https://www.noaa.gov/jetstream/wxmaps

Understanding these symbols can make the Weather Fronts layer in IW Pro much more useful and give you a better picture of what is happening in the atmosphere when you are watching weather develop on radar.

Understanding Storm Relative Velocity (SRV) in IW Pro

Storm Relative Velocity (SRV) is one of the newest radar products available in IW Pro, giving weather enthusiasts another powerful tool for analyzing severe thunderstorms.

While standard Velocity remains the preferred product for most situations, Storm Relative Velocity can make areas of rotation easier to identify when storms are moving quickly.

What is Storm Relative Velocity?

Storm Relative Velocity is based on Doppler Velocity data but with one important difference: it removes the overall forward motion of the storm.

When thunderstorms are moving rapidly, that forward motion can sometimes make it more difficult to identify localized areas of rotation. By subtracting the storm's movement, SRV allows you to focus on the winds relative to the storm itself.

This makes Storm Relative Velocity particularly useful when investigating fast-moving severe thunderstorms, supercells, and squall lines that may contain embedded rotation.

Before You Begin

Storm Relative Velocity requires Storm Tracks to be enabled in Settings.

SRV uses the Storm Tracks system to estimate the storm's motion. Without Storm Tracks enabled, Storm Relative Velocity cannot calculate the storm-relative wind field.

If you do not see SRV working as expected, first confirm that Storm Tracks is turned on.

When Should I Use Storm Relative Velocity?

Storm Relative Velocity is most useful when storms are moving at moderate to fast speeds.

Examples include:

  • Fast-moving severe thunderstorms

  • Supercells

  • Squall lines with embedded rotation

  • Investigating possible areas of storm rotation

Because the storm's forward motion has been removed, localized areas of rotation may become easier to recognize than they are on the standard Velocity product.

When Should I Use Standard Velocity?

Standard Velocity remains the best choice for most situations.

For slow-moving storms, Storm Relative Velocity often provides little additional benefit and may actually be more difficult to interpret.

Think of SRV as another tool in your weather toolbox rather than a replacement for Velocity. Comparing both products together often provides the best understanding of what is happening within a storm.

Triple Panel Mode Makes Comparison Easy

One of the easiest ways to use Storm Relative Velocity is in IW Pro's Triple Panel Mode.

Configure the panels as:

  • Left: Reflectivity (REFL)

  • Centre: Velocity (VEL)

  • Right: Storm Relative Velocity (SRV)

This allows you to compare storm structure, wind motion, and storm-relative wind motion all at the same time.

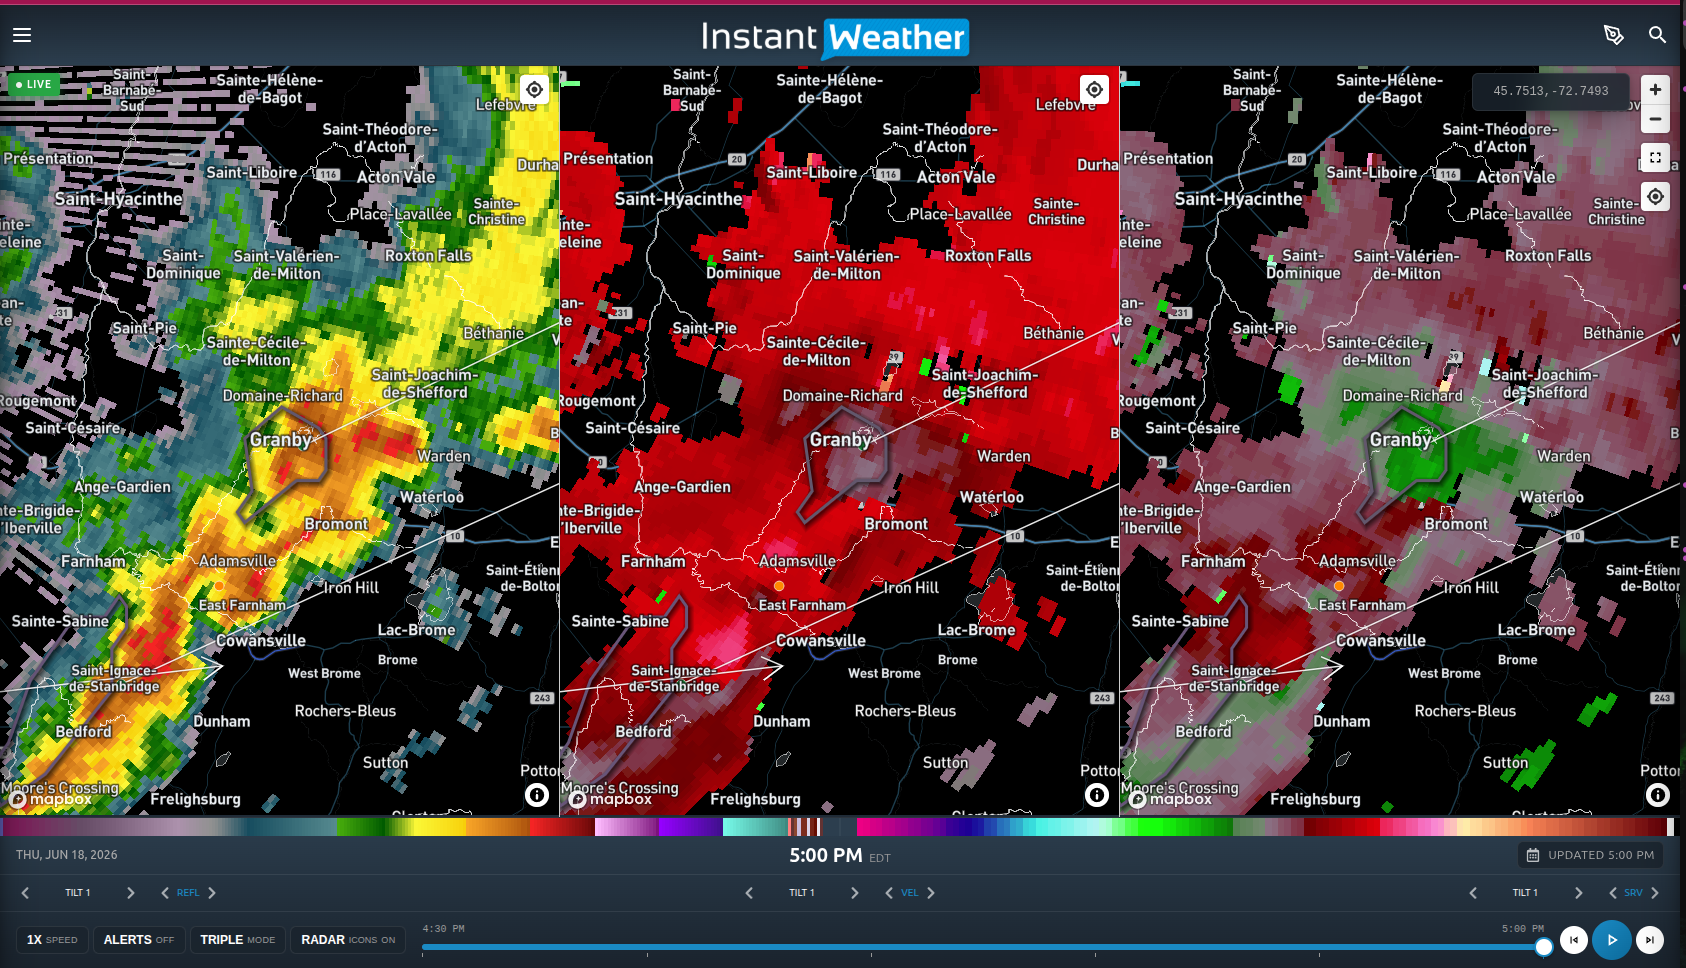
Figure 1. Triple Panel Mode showing Reflectivity, Velocity, and Storm Relative Velocity. The storm in this example is moving northeast at approximately 62 km/h. Because of the storm's relatively fast movement, Storm Relative Velocity helps make localized areas of rotation easier to identify.

Notice that the differences between Velocity and Storm Relative Velocity may sometimes be subtle. SRV is designed to highlight rotation by removing the storm's forward motion. It is not intended to completely change the appearance of the radar image.

Looking at the Example

In the Reflectivity panel (left), we can see the overall structure and intensity of the thunderstorm.

The Velocity panel (centre) shows the winds moving toward and away from the radar. Because the storm itself is moving quickly, that overall motion influences the velocity display.

The Storm Relative Velocity panel (right) removes much of that forward motion, making localized wind patterns easier to examine. This can make subtle areas of rotation stand out more clearly than they do on the standard Velocity product.

Notice that this does not necessarily indicate a tornado. Rotation within thunderstorms is relatively common and can vary significantly in strength. Storm Relative Velocity is simply another tool that can help you better understand what is happening inside a storm.

Using SRV Alongside Other IW Pro Features

Storm Relative Velocity works best when combined with IW Pro's other advanced tools.

As you analyze a storm, compare:

  • Reflectivity to see the storm's structure.

  • Velocity to view the actual winds detected by the radar.

  • Storm Relative Velocity to better identify localized areas of rotation in fast-moving storms.

  • Storm Tracks to understand where the storm is moving.

  • StormRisk™ to view computer generated severe weather probabilities.

No single radar product tells the entire story. Using several products together provides the most complete picture of a storm's behaviour.

A Powerful New Tool for Canadian Weather Enthusiasts

Storm Relative Velocity has long been used by meteorologists as an additional tool for analyzing severe thunderstorms. IW Pro now brings this capability to Canadian weather enthusiasts, providing another way to explore and better understand fast-moving storms.

We encourage you to experiment with Storm Relative Velocity during the next severe weather event and compare it with standard Velocity. With a little practice, you'll quickly learn when SRV can provide additional insight into storm rotation and when standard Velocity is the better choice.

Weather Alerts in IW Pro: More Control Than Ever

IW Pro now includes a powerful set of Weather Alert controls, giving you more flexibility over what you see and how you see it.

Control official weather alerts and how they appear on the map

IW Pro displays official weather alerts from Environment Canada and the U.S. National Weather Service, and now you can fully customize how those alerts appear.

Customize the Alerts You Receive

You can now choose exactly which alerts matter to you.

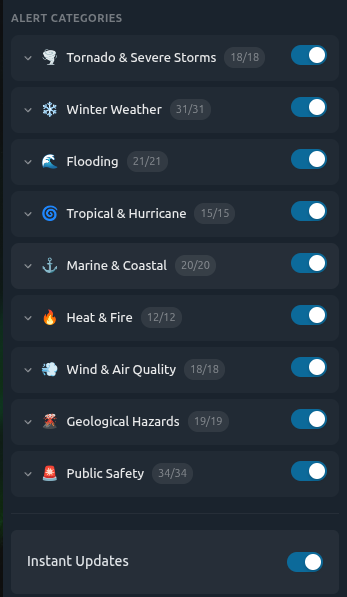
Under Weather Alerts, you’ll find:

  • Canada Alerts and U.S. Alerts toggles

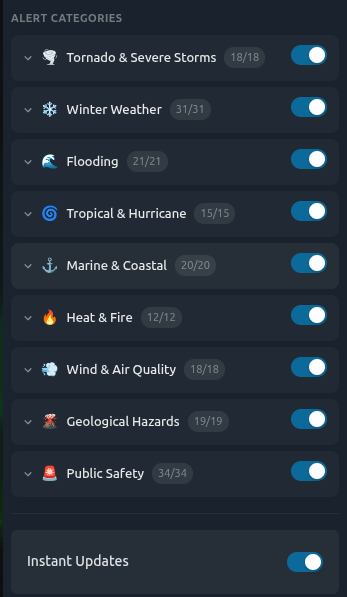
  • Full control over alert categories, including:

    • Tornado & Severe Storms

    • Winter Weather

    • Flooding

    • Tropical & Hurricane

    • Marine & Coastal

    • Heat & Fire

    • Wind & Air Quality

    • Geological Hazards

    • Public Safety

Choose which types of official alerts you want to see

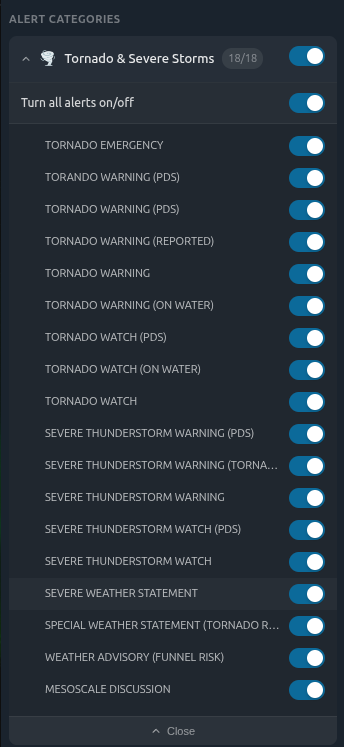
Each category can be expanded so you can turn individual alerts on or off (for example, Blizzard Warnings, Snow Squall Warnings, or Severe Thunderstorm Watches).

Customize individual alert types within each category

This allows you to reduce noise and focus only on the alerts that matter most to you.

Turn Alerts On or Off Anytime

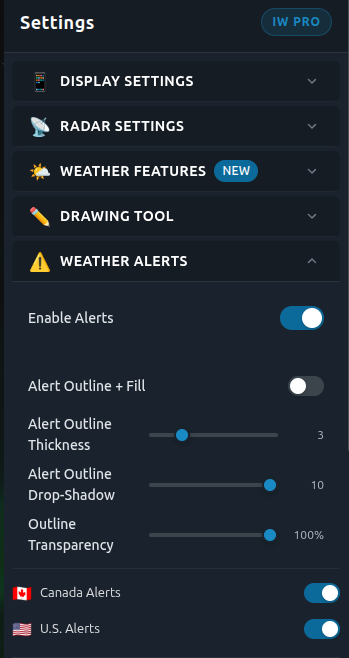
At the top of the section, you’ll see a simple Enable Alerts toggle.

  • Turn it on to display official alerts on the map

  • Turn it off to hide them completely

Control How Alerts Look on the Map

You can also adjust how alerts appear visually:

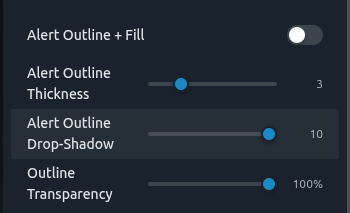
  • Alert Outline + Fill (on/off)

  • Outline Thickness

  • Drop Shadow

  • Transparency

Adjust how alerts appear with outlines, shadows, and transparency

This helps you balance visibility without overwhelming the radar view.

Instant Updates (IW Pro)

In addition to official alerts, IW Pro includes Instant Updates.

These are not official weather alerts. They are issued by the Instant Weather team to provide additional real-time insights, such as:

  • Rotation detected

  • Developing storm features

  • Other notable conditions

You can turn Instant Updates on or off separately, depending on how much additional information you want to see.

nstant Updates are separate from official alerts and provide additional real-time insights from the Instant Weather team

Why This Matters

Previously, it was not always clear:

  • Which alerts were being shown

  • Why certain alerts appeared

  • Or how to filter them

Now, you are in full control of both:

  • Official alerts from trusted sources, and

  • Additional insights from the Instant Weather team

If you have any feedback on the new alert settings, let us know. We are continuing to improve IW Pro based on your input.


Canadian Radar Outages Now Available in IW Pro

We have added a new feature in IW Pro that provides more transparency around radar coverage across Canada.

You can now see when and where Canadian weather radars are experiencing outages directly on the map.

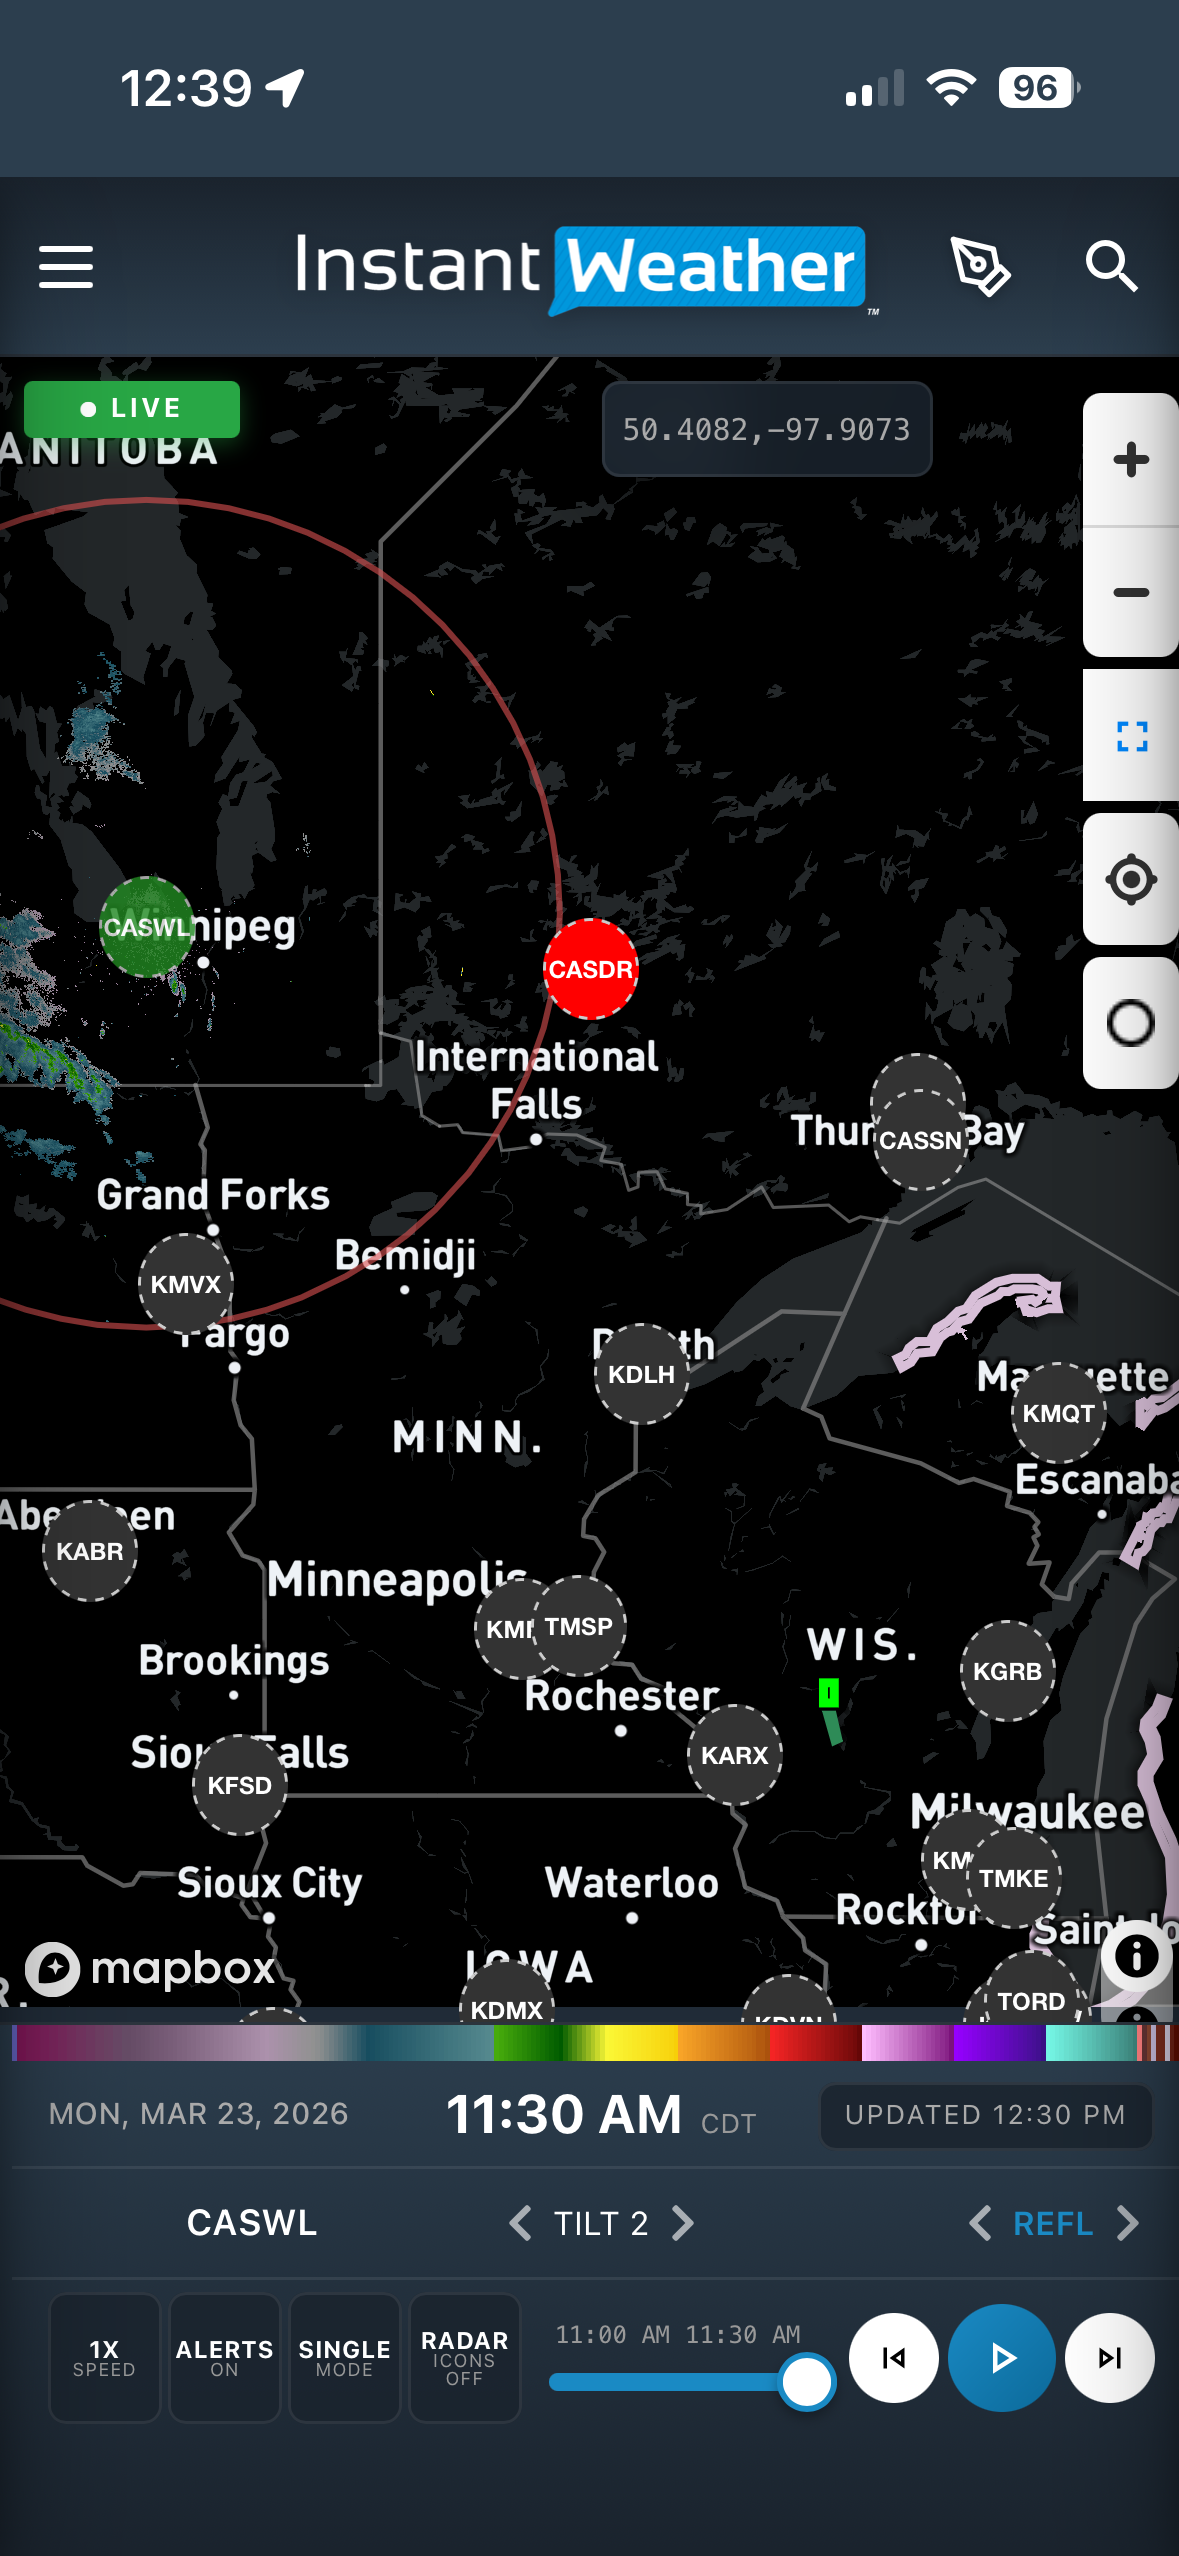
When a radar is offline or undergoing maintenance, a red radar icon will appear at that location (see image below). Simply tap or click the icon to view more details about the outage.

Screenshot 1: Red radar icon shown on the map

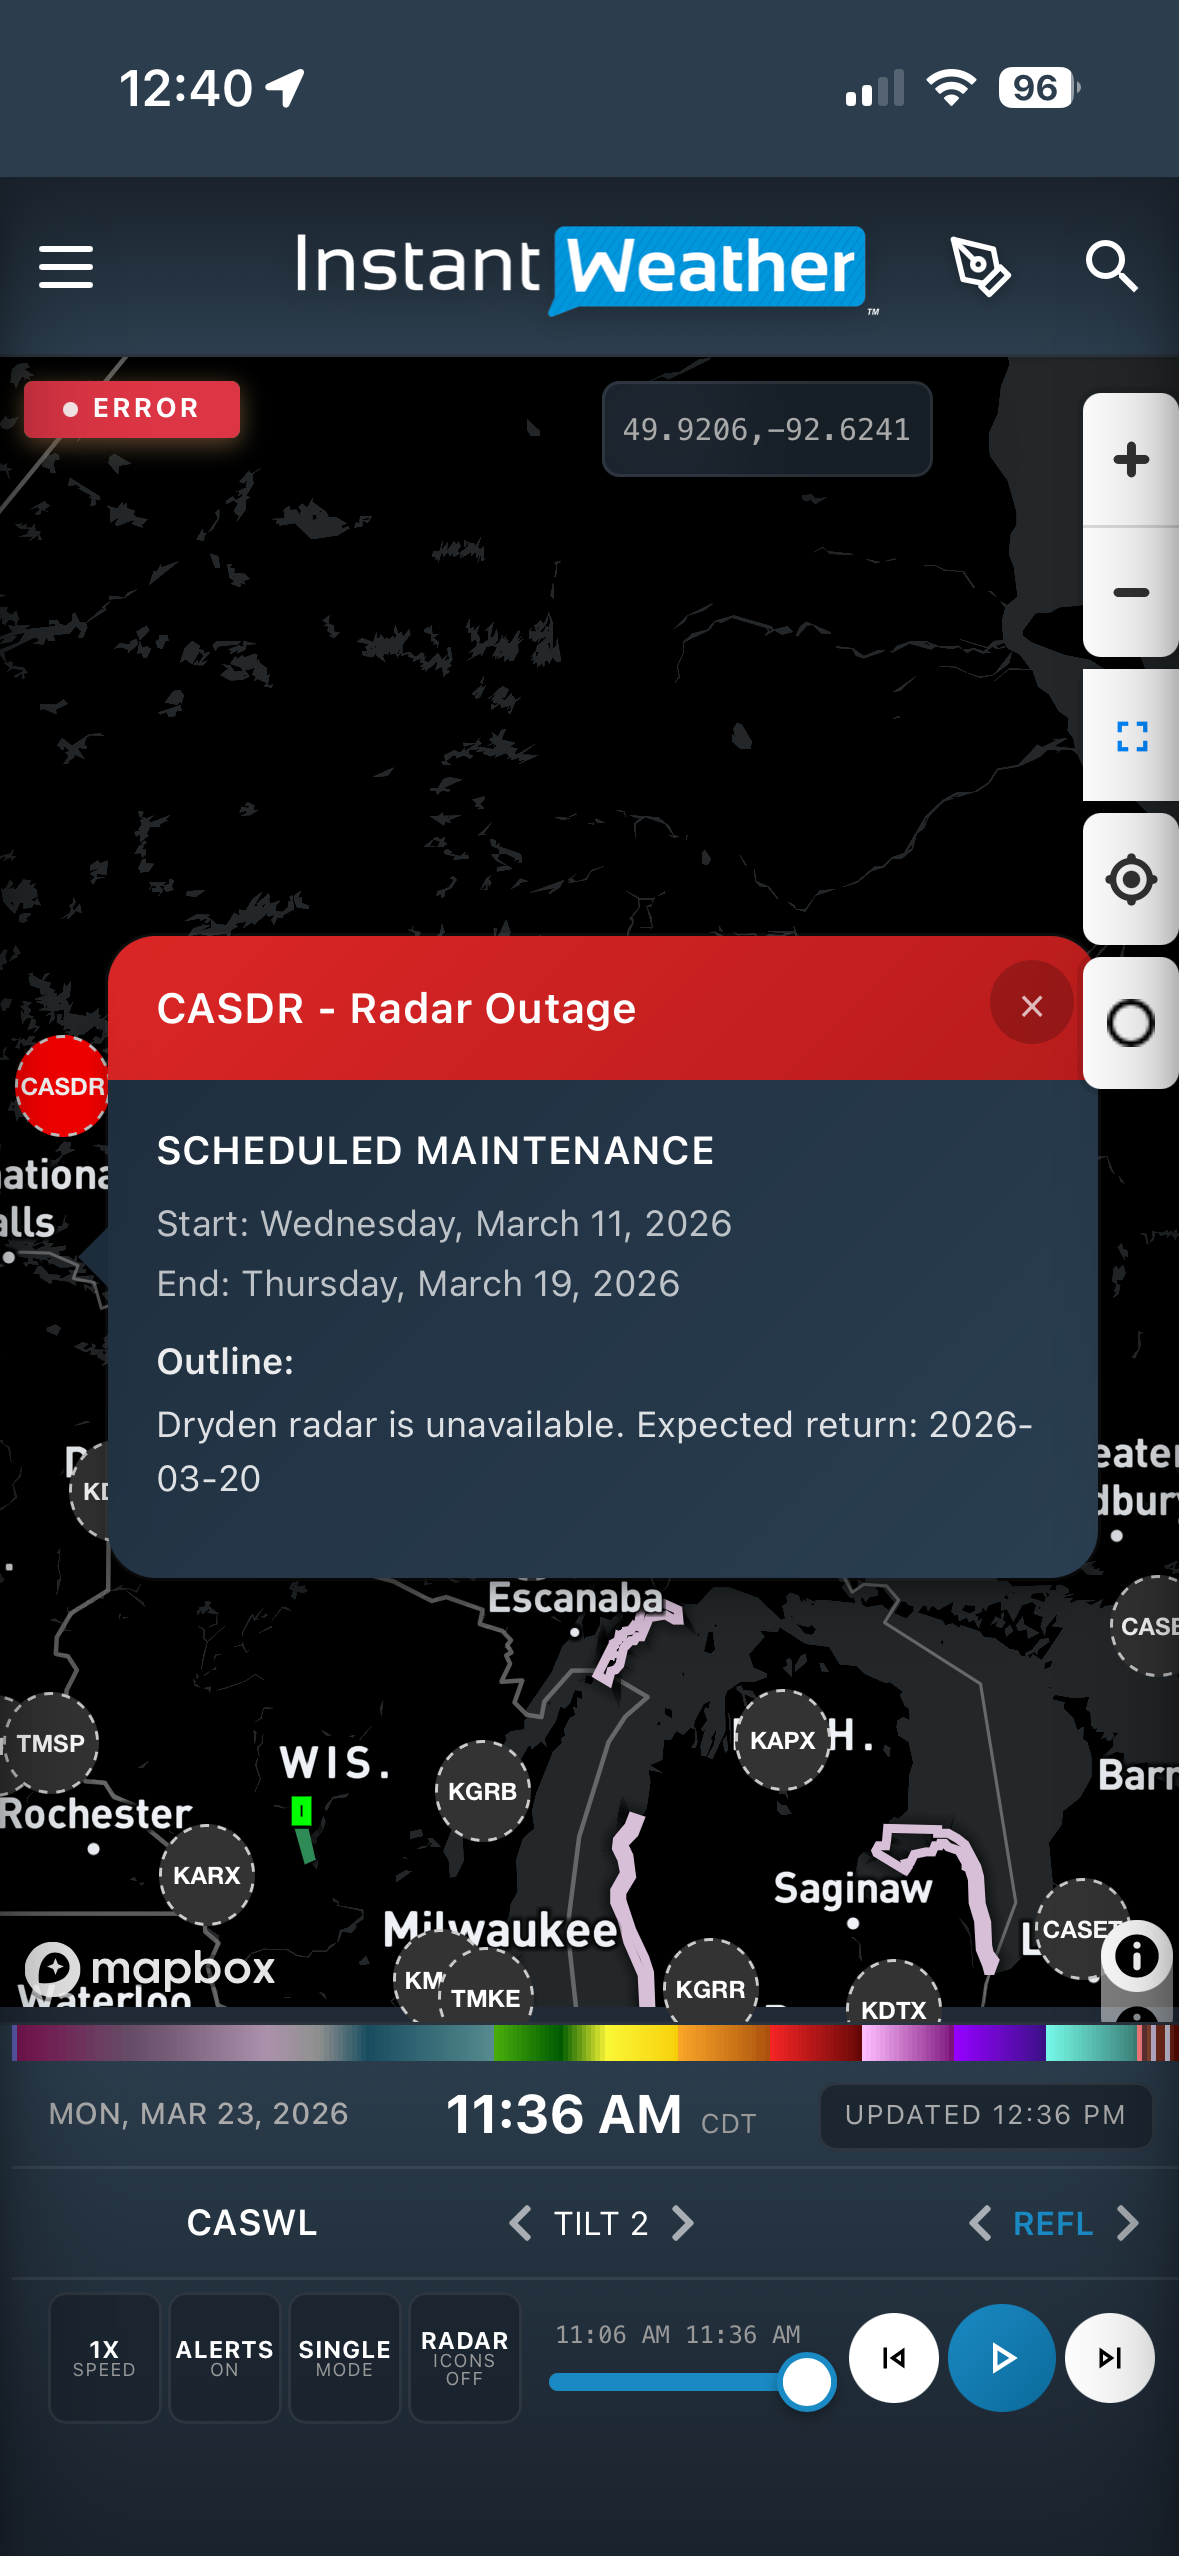
After selecting the icon, you will see additional information about the outage, including details provided by Environment and Climate Change Canada.

Screenshot 2: Radar outage details after tapping the icon

Previously, it was not always clear whether an issue was with IW Pro or the radar station itself. This update helps remove that uncertainty by clearly showing when a radar outage is the cause.

Outage information is based on data from Environment and Climate Change Canada:

https://www.canada.ca/en/environment-climate-change/services/weather-general-tools-resources/radar-overview/outages-maintenance.html

We are continuing to improve how radar data is displayed in the app, and this is another step toward making the experience clearer and more reliable.


🛠️ IW Pro Settings Overview (last reviewed May 2025)

To open the Settings menu, tap or click the three bars in the upper-left corner of the screen.
Here’s a description of each setting. Some have recommended values, but many can be toggled based on your needs. We often switch them on and off during active use.

IW Pro settings

🔧 Settings Breakdown

Layer Opacity
Adjusts the transparency of the radar layer on the map.

Live Mode
When enabled, IW Pro auto-loads new radar frames as they become available.

Velocity Color

  • Velocity 1: Red/blue (Environment Canada standard)

  • Velocity 2: Red/green (more common in U.S.-based radar apps)

NEW – Velocity & Measurement Format
Choose between mph/kph. This setting also determines the units for the measurement tool (mi or km).

Radar Placement Accuracy

  • Recommended: 11 for most devices

  • Use 8 for slower performance

Labels and Boundaries
Toggle on or off to show location names and boundaries.

Time Display
Choose between 12-hour or 24-hour time format.

Canadian Radar Noise Reduction

  • On: Reduces radar interference spikes (“laser beams”)

  • Off: Shows additional features like hail spikes and faint outflow boundaries

Hail Size Estimation
This feature may not be available in the current production version. It was visible in recent builds but has been temporarily removed as we rolled back to a previous version due to performance issues. It may return in a future update.

Lightning Data
Toggle on to view real-time lightning strike locations on the map.

Mosaic Radar Layer
Shows the combined radar mosaic when no specific radar station is selected.
Tip: We recommend also turning off radar icons when using this layer.

NEW – IW StormRisk (Beta)
Displays IW’s experimental storm risk overlay.
[See this blog post for more details.]

NEW – Thunderstorm Forecasts
Shows Environment Canada’s “Thunderstorm Outlooks.”
Choose a time period and opacity level.
[See this blog post for details.]

Alerts
Turn this on to display alerts on the map. You can customize which types of alerts to show:

  • ECCC Alerts (from Environment Canada)

  • IW Instant Updates (our own real-time updates)

  • U.S. Alerts (from U.S. National Weather Service)

    You can also choose which specific alert types appear:

  • Instant Updates

  • Warnings

  • Watches

  • Statements and Advisories

  • U.S. Alerts
    Note: You can mix and match alert types and sources based on your preferences.

💡 Tip

To quickly reload radar data, toggle between Single, Split, and Dual modes.

Environment Canada's "Thunderstorm Outlooks"

Environment Canada's official "Thunderstorm Outlooks" have been integrated into Instant Weather PRO!

Day 1, Night 1, Day 2 and Day 3 are all be included with full details when you select the forecast on the map.

Screenshot of ECCC Thunderstorm Forecast

You can select a day or turn it off in rendering parameters. You can also specify the opacity.

Here are a couple more examples including a funnel cloud risk.

IW StormRisk storm track arrows and colour key

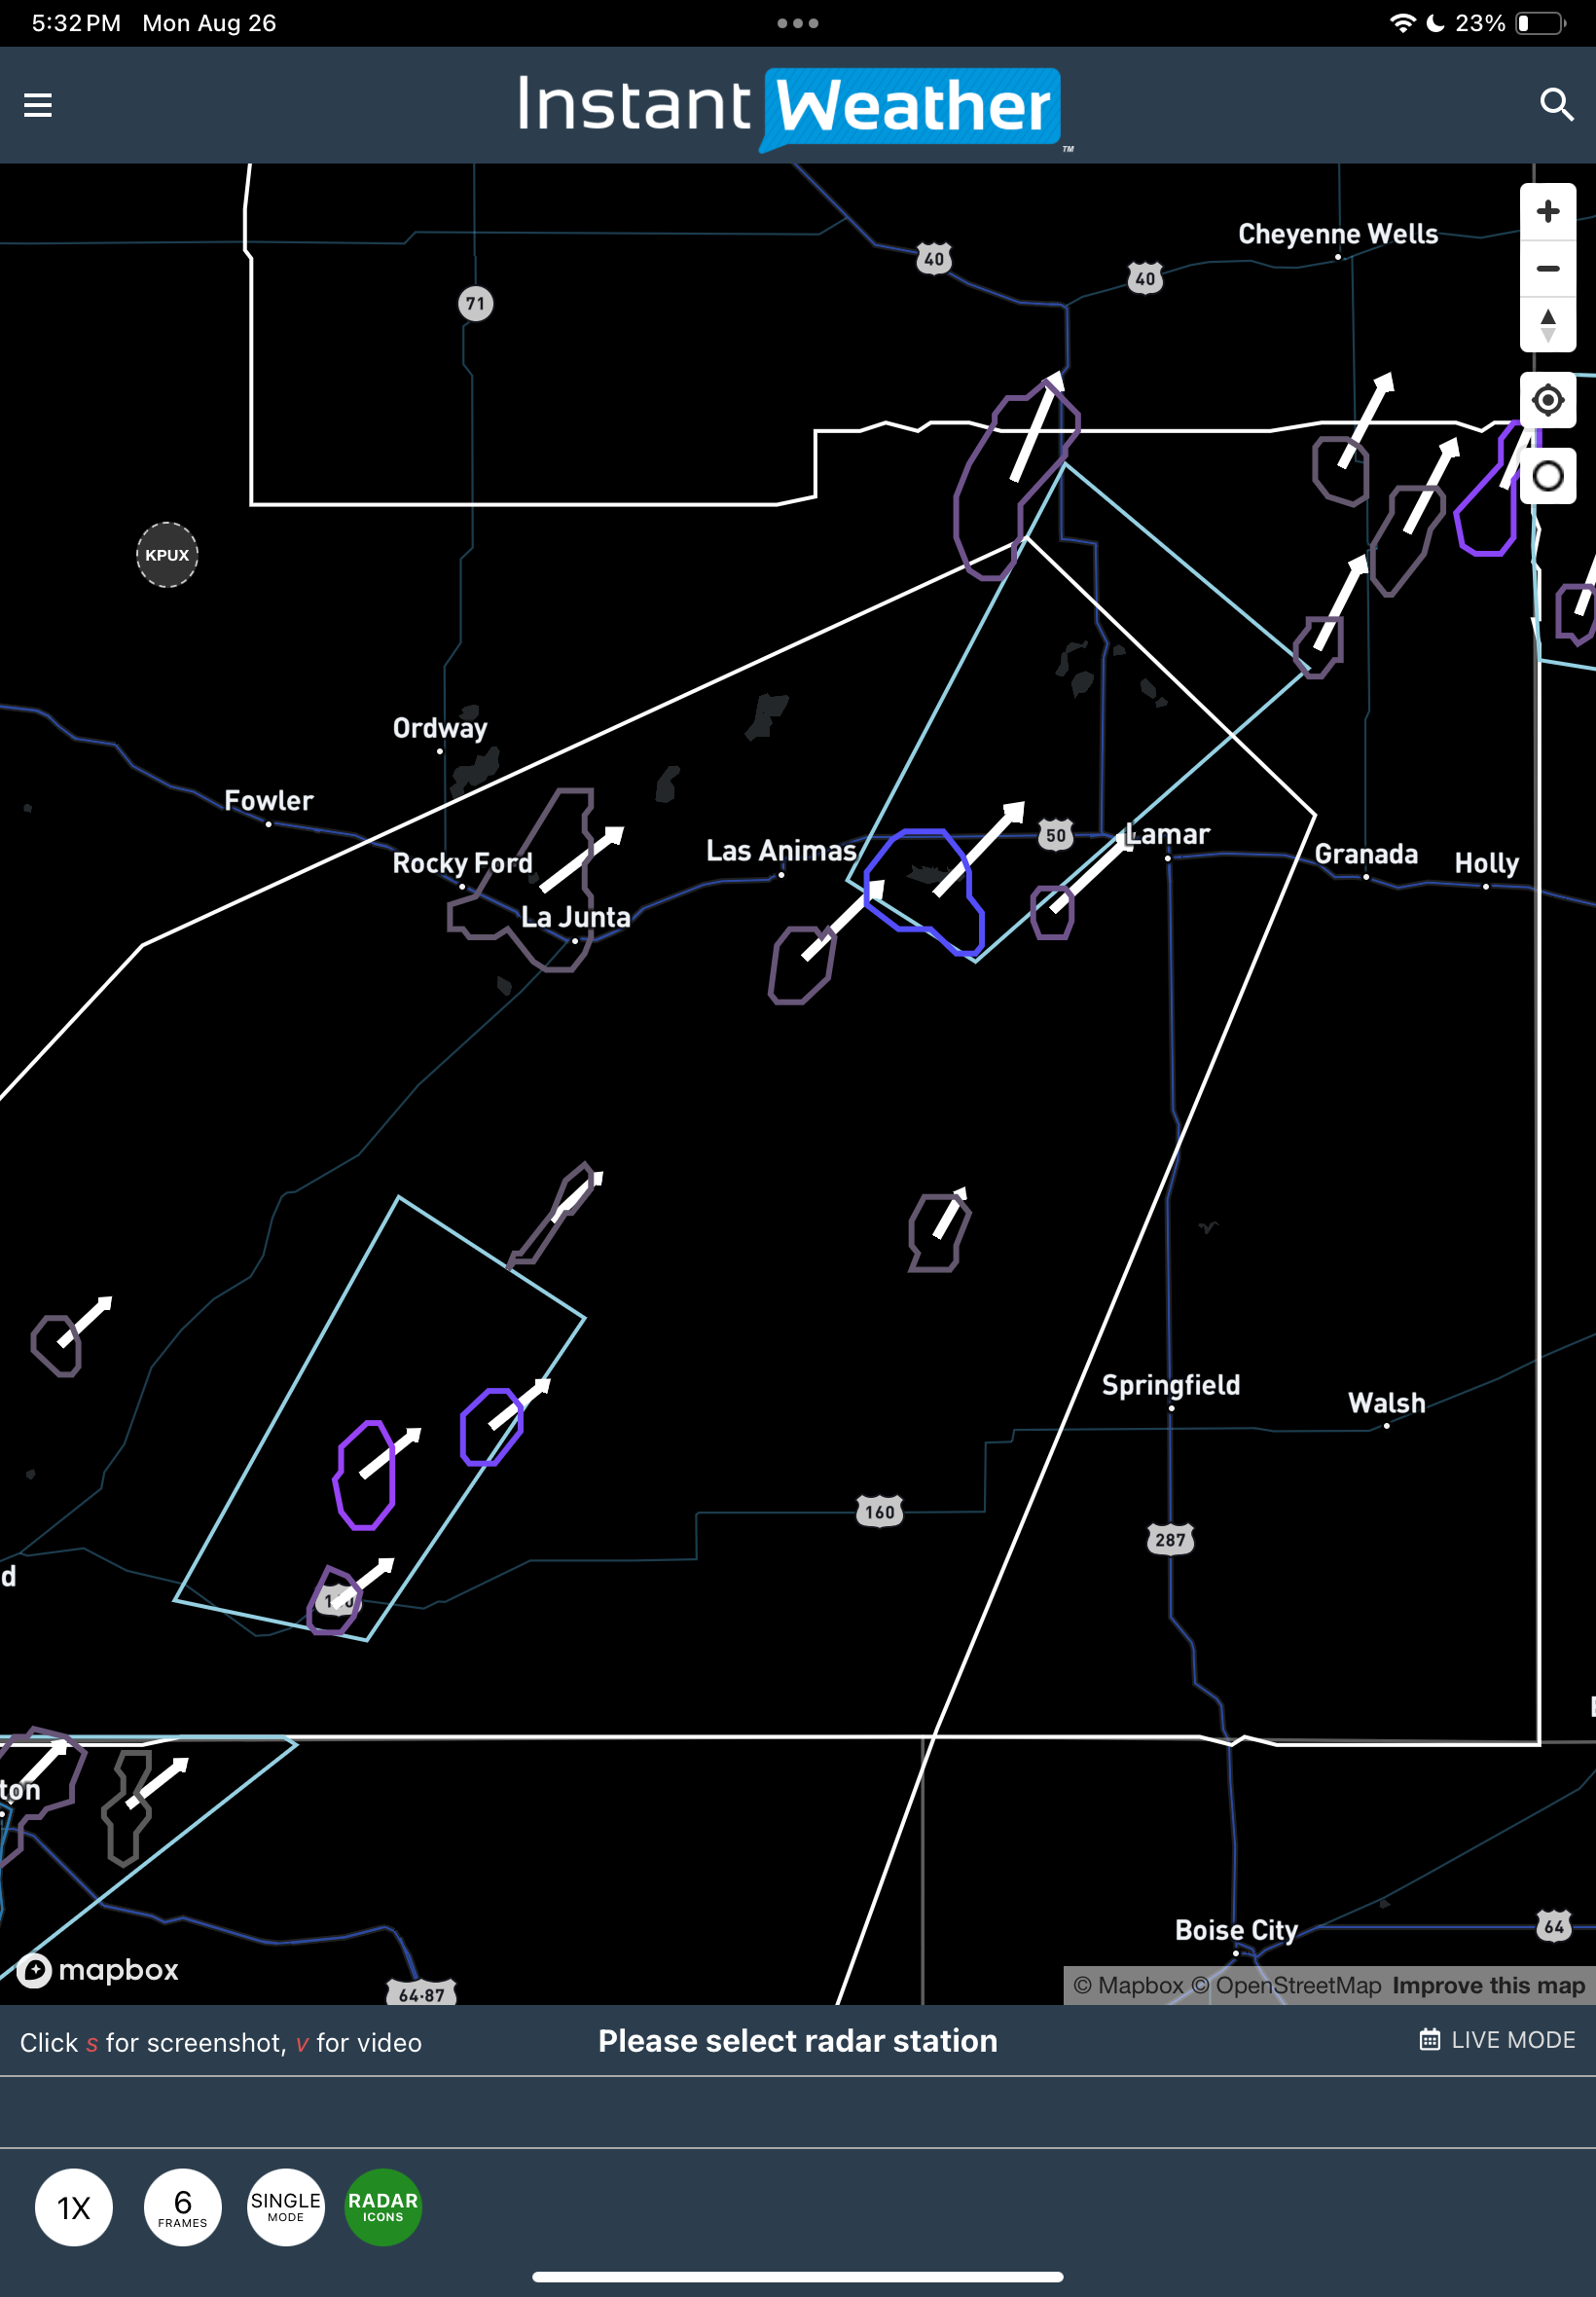
The StormRisk storm track arrows have been added so that you can see the predicted direction of travel of the storm(s).

With the radar turned on:

Here are some examples of the colours of the outlines with the Total Severe Risk percentages. Note that the thickness of the outline also increases when the risk increases as well. You can see that in some of the examples where there is another outline present in the screenshots (24-48).

Note that the black colour for greater than 85% is a bug. You will not be able to see against the black map but it will show up well when radar is on.

IW StormRisk is live

IW StormRisk is live for all IW Pro users and combined alert polygons are live in Canada as well!

To turn on IW StormRisk just click on the menu (three bars at the top left) and click to turn it on:

IW StormRisk only works as far north as 51N (basically just south of Calgary) but we have plans to extend it further north to 55N, which will include locations like Saskatoon and Edmonton.

The thickness of the outline is related to the risk level as well as the colour of the outline is related to the type of risks. Here are some examples:

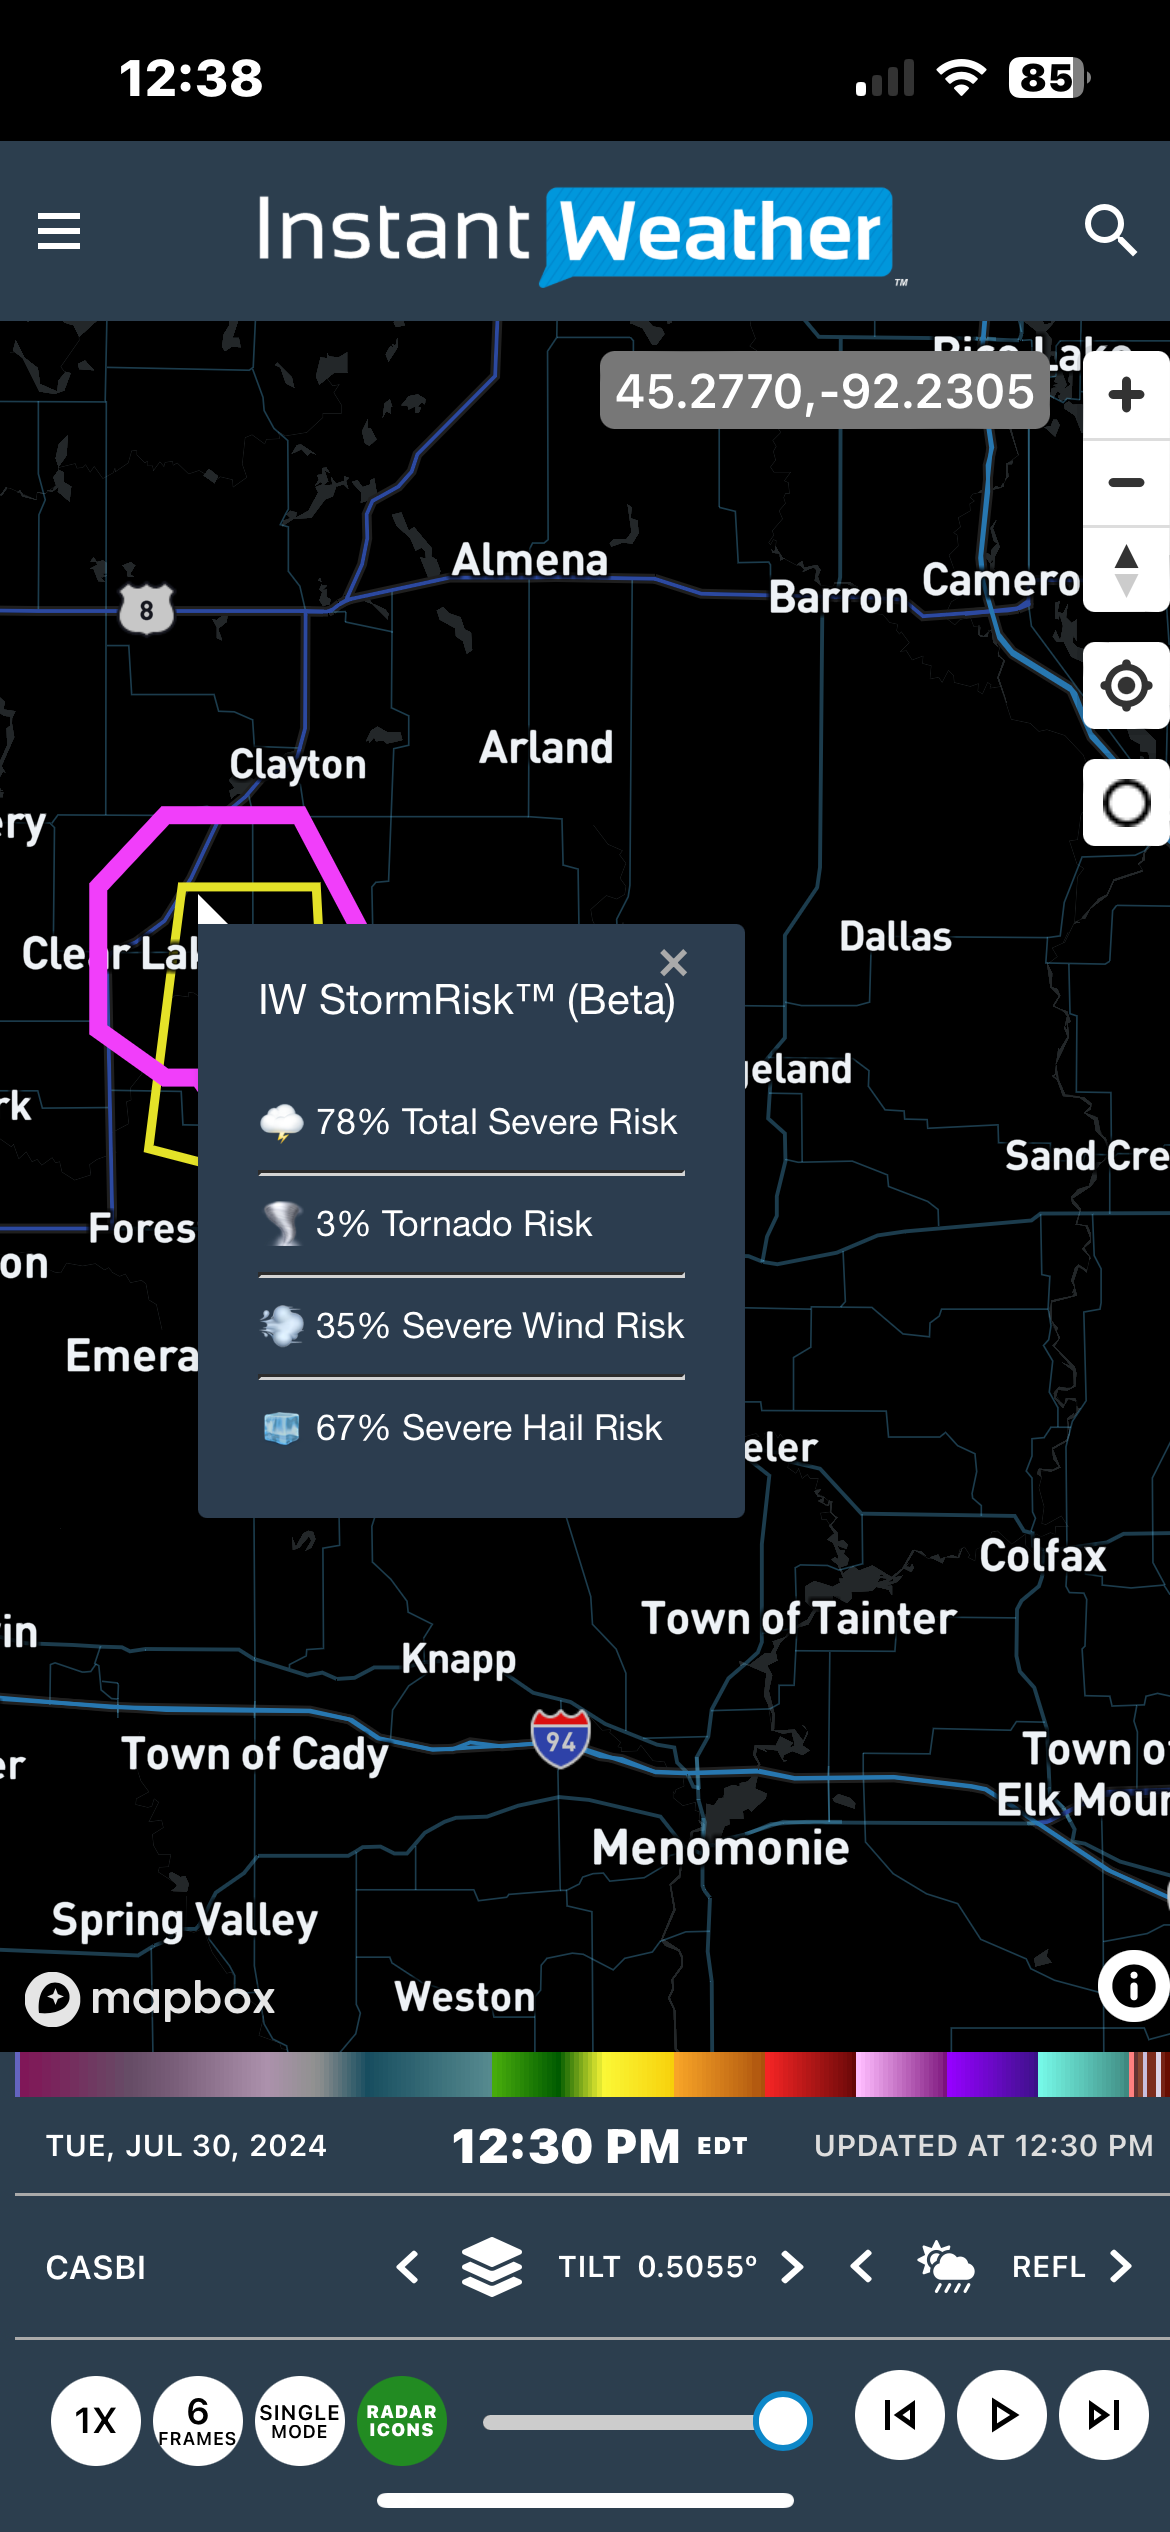
Look for irregular shapes and click on them to see the IW StormRisk: