Instant Weather Help Centre

Welcome to the Instant Weather Help Centre!

Whether you're using the Instant Weather app, IW Pro, or Text Message Alerts, you'll find helpful information about our services, instructions for using features, and answers to common questions.

We're continually adding new articles and updating existing information as features change and new questions arise.

📱 Instant Weather App

Learn how to use the Instant Weather app and make the most of its weather forecasts, radar, alerts, and other features.

Explore the Instant Weather App to learn more about its features, subscription options, and download it from the Apple App Store or Google Play Store.

Help Articles

Understanding the Weather Pages

Learn about the different Weather Page styles, current weather conditions, hourly and daily forecasts, and how to customize your weather display.

Understanding the Radar in the Instant Weather App

Learn how to use the radar, understand precipitation colours, explore past and future radar, and view weather alerts and Instant Updates.

Using Report Weather in the Instant Weather App

Learn how to submit weather reports, share photos and videos, and help keep others informed about developing weather conditions.

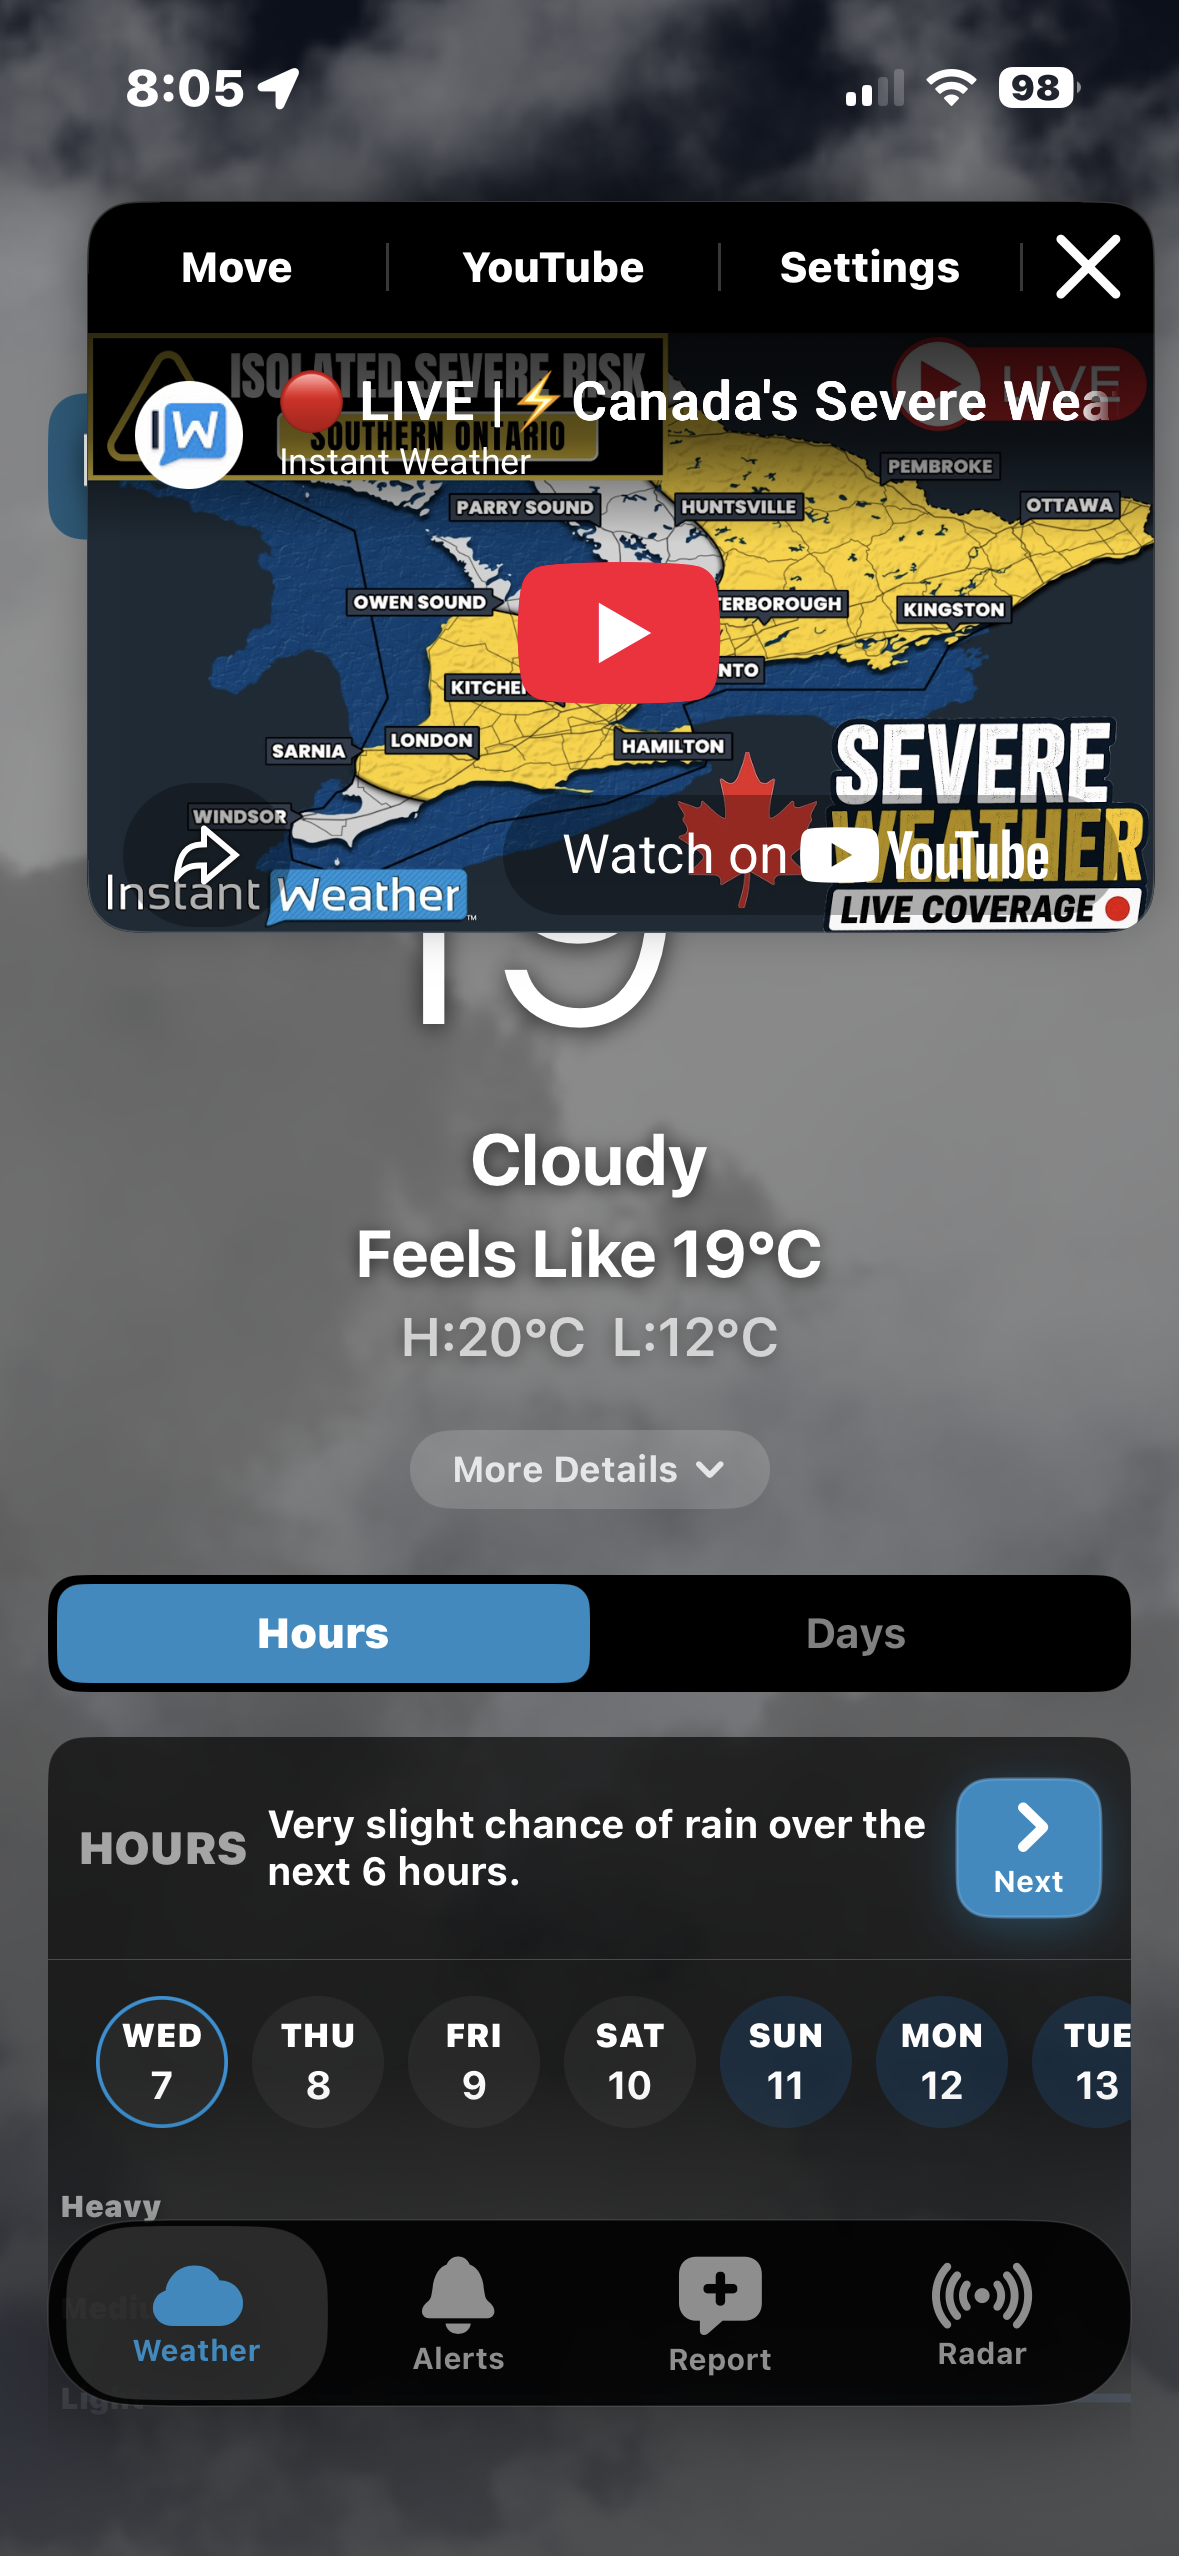
What Does the Red LIVE Badge Mean?

Find out what the LIVE badge means and how to watch Instant Weather livestreams.

Air Quality (AQI) Now Available

Learn how to check current air quality conditions, view hourly AQI forecasts, explore interactive air quality maps and understand AQI levels and pollutants.

🌩️ IW Pro

IW Pro provides advanced weather radar and analysis tools for tracking storms and examining weather conditions in greater detail. For detailed instructions and tutorials on using IW Pro, visit our IW Pro Blog.

  • Learn More About IW Pro: Explore IW Pro features and subscription information.

  • IW Pro Blog: Browse tutorials, examples, feature explanations, and troubleshooting guides to help you get the most out of IW Pro.

For questions about your IW Pro subscription or account, please contact our support team.

📱 Text Message Alerts

Instant Weather Text Message Alerts (TMA) deliver severe weather information directly to your phone by text message, including official weather alerts and Instant Weather's own severe weather updates.

Need Help Accessing Your TMA Account?

Online account access requires setup, and not all subscribers have access to every login method.

If you haven't set up online access, are unsure which login method to use, or are having trouble signing in, please email help@instantweather.ca for assistance.

Please include the cellphone number associated with your Text Message Alerts subscription so we can locate your account and assist you.

Note: Text Message Alerts require a separate subscription from the Instant Weather app.

💳 Subscriptions & Billing

Need help with your subscription?

We can assist with questions about:

  • Identifying which Instant Weather subscriptions you have

  • Subscription renewals and cancellations

  • Billing and payment questions

  • Accessing your subscription or restoring purchases

  • Refund requests

Instant Weather app subscriptions, IW Pro, and Text Message Alerts may have different subscription and billing arrangements.

If you're unsure which service you're subscribed to or how your subscription is billed, please contact us for assistance.

💬 Still Need Help?

Can't find the answer you're looking for? Our support team is happy to help.

Contact Support

Email: help@instantweather.ca

When contacting us about an issue with the Instant Weather app, please include as much of the following information as possible:

  • Device model: For example, iPhone 16 or Samsung Galaxy A36

  • Operating system version: iOS or Android version

  • App version: Found at the bottom of Settings in the Instant Weather app

  • Description of the issue: What happened and what you were doing when the problem occurred

  • Screenshots or screen recordings: If available

Providing these details helps us investigate and resolve issues more efficiently.

Your questions and feedback also help us identify new topics to add to the Help Centre.
Air Quality (AQI) Now Available

The Instant Weather app provides Air Quality Index (AQI) information to help you understand current air quality conditions and how they may change over time.

You can check current AQI readings, explore hourly forecasts, view interactive air quality maps and learn about individual air pollutants.

Available in version 2.3.141 and later for iOS and Android.

Quick Start: Check Air Quality in Instant Weather

Instant Weather lets you check current air quality, view hourly forecasts and explore air quality conditions on a map.

1. Check Current Air Quality

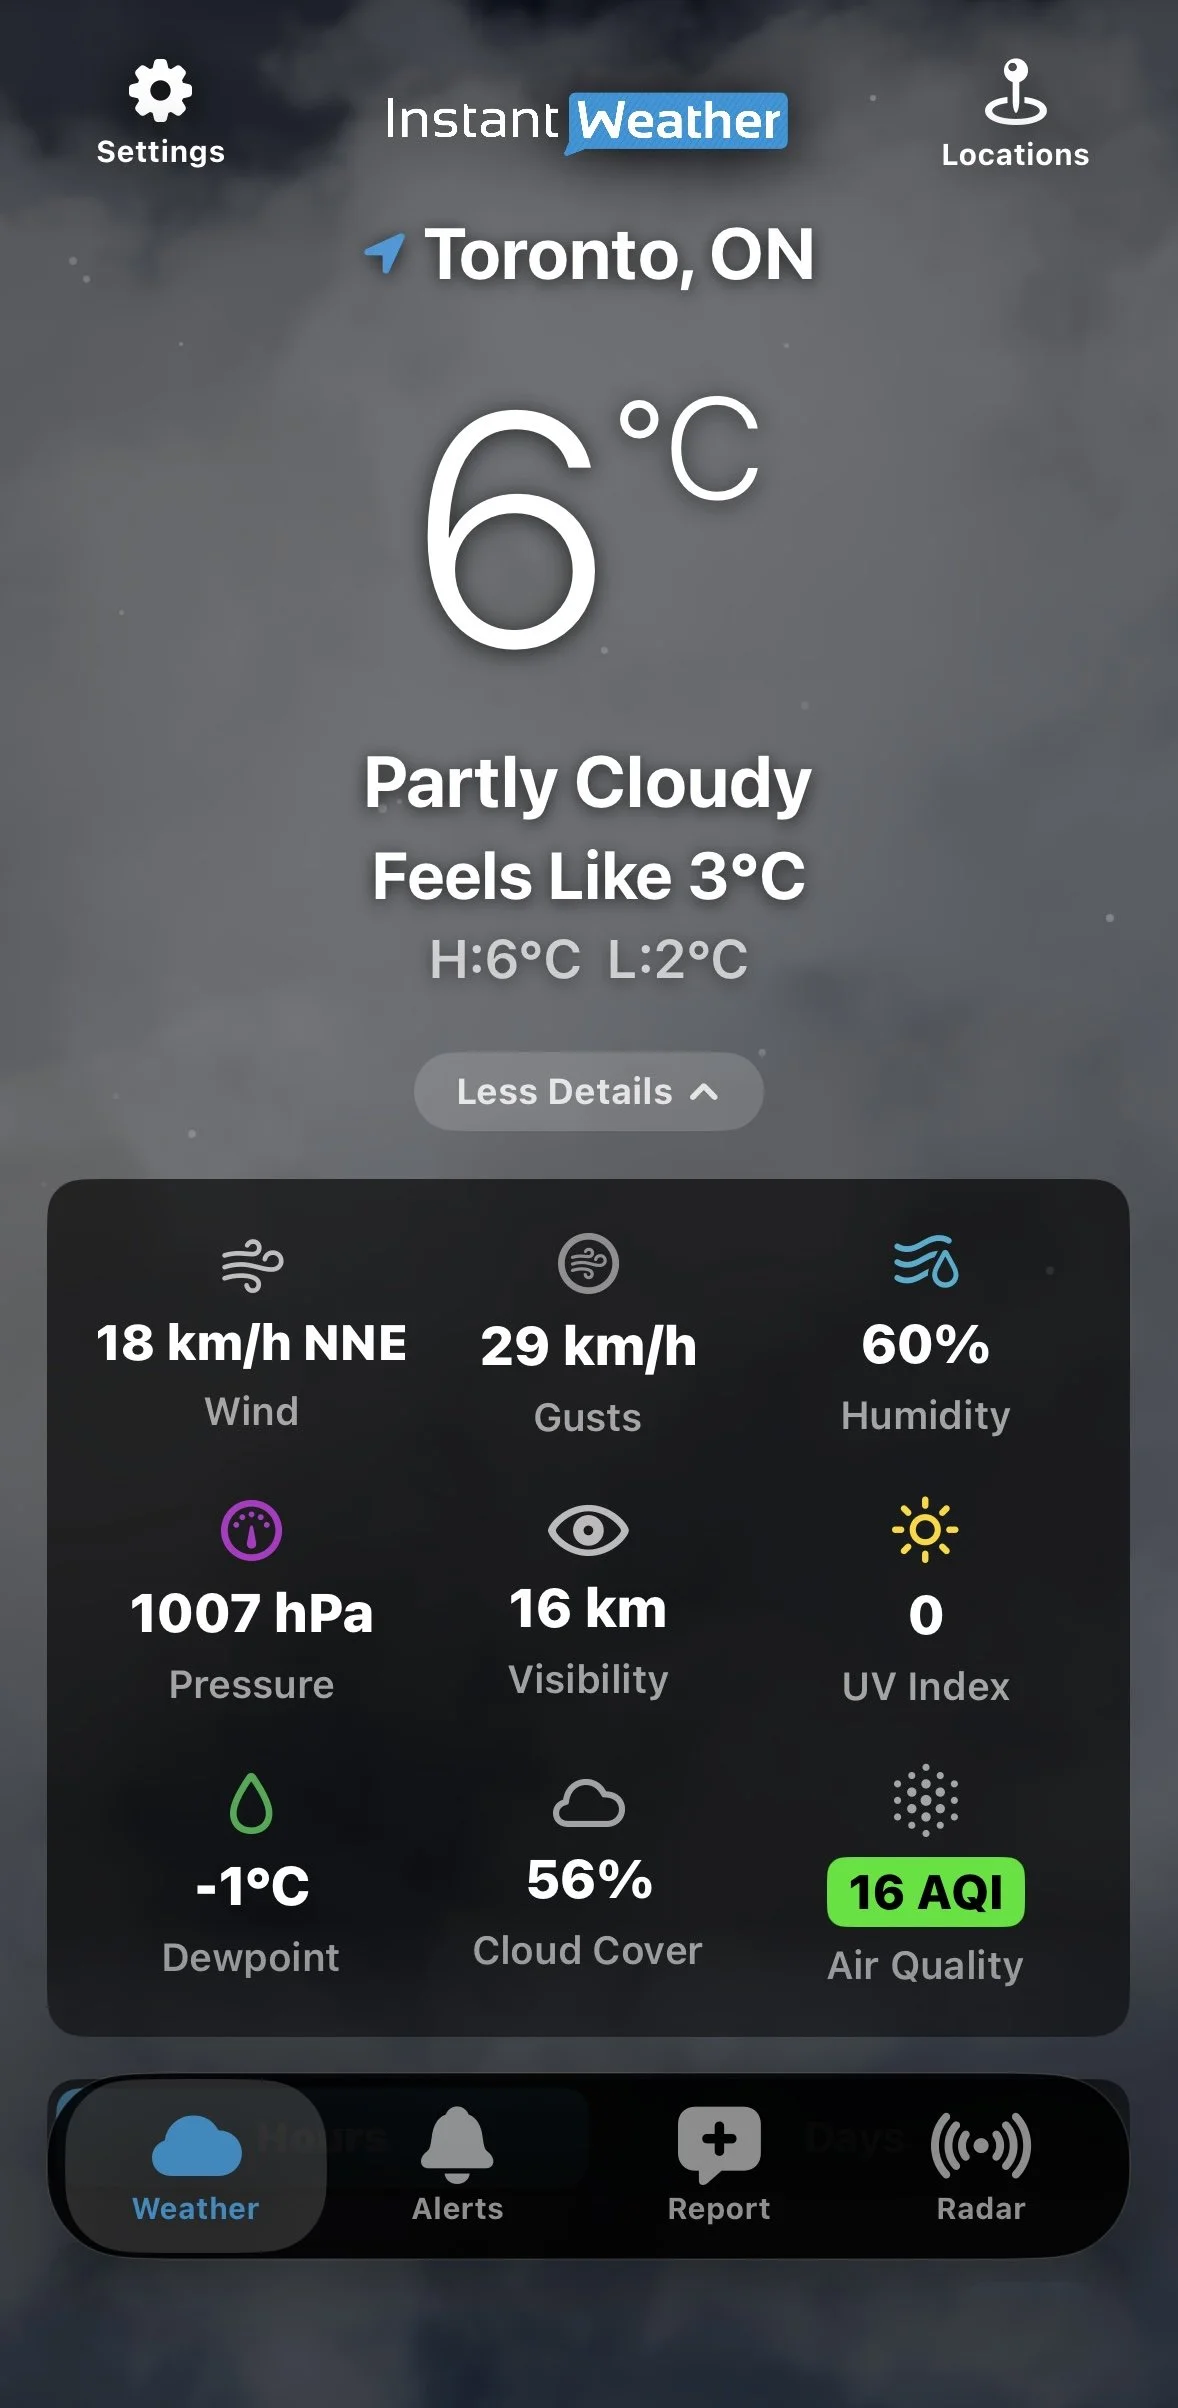
On the Weather page, tap More Details beneath the temperature.

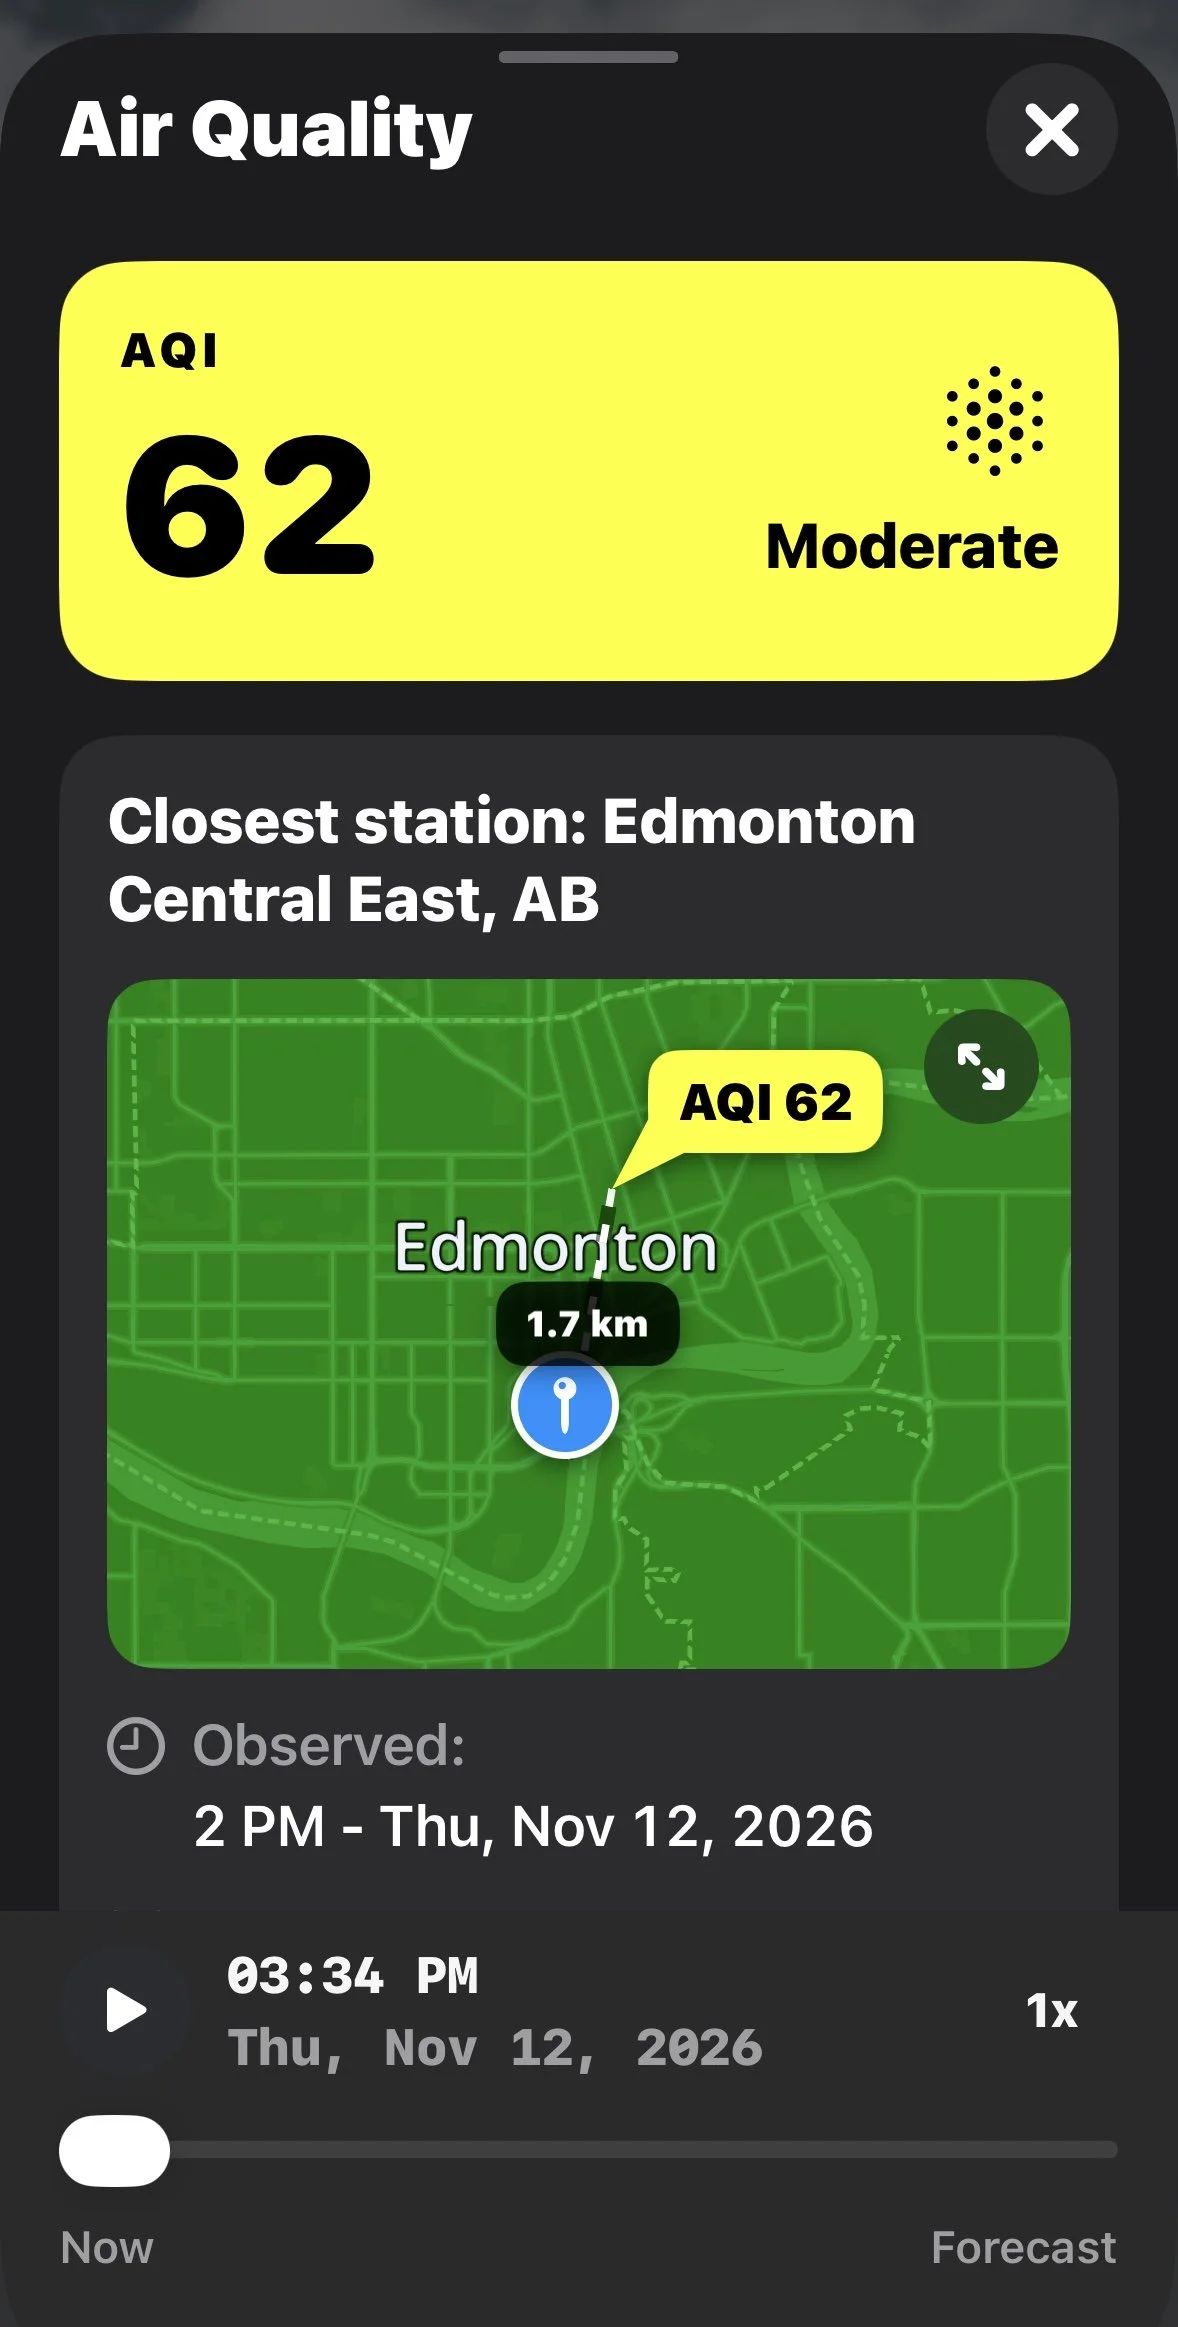
Find the colour-coded Air Quality (AQI) value and tap it to see detailed information, including the closest monitoring station and individual pollutants.

Current Air Quality

2. View the Hourly AQI Forecast

Scroll down to Hours and tap Details and more products beneath the hourly forecast. You can also tap an individual hourly forecast period to expand its details.

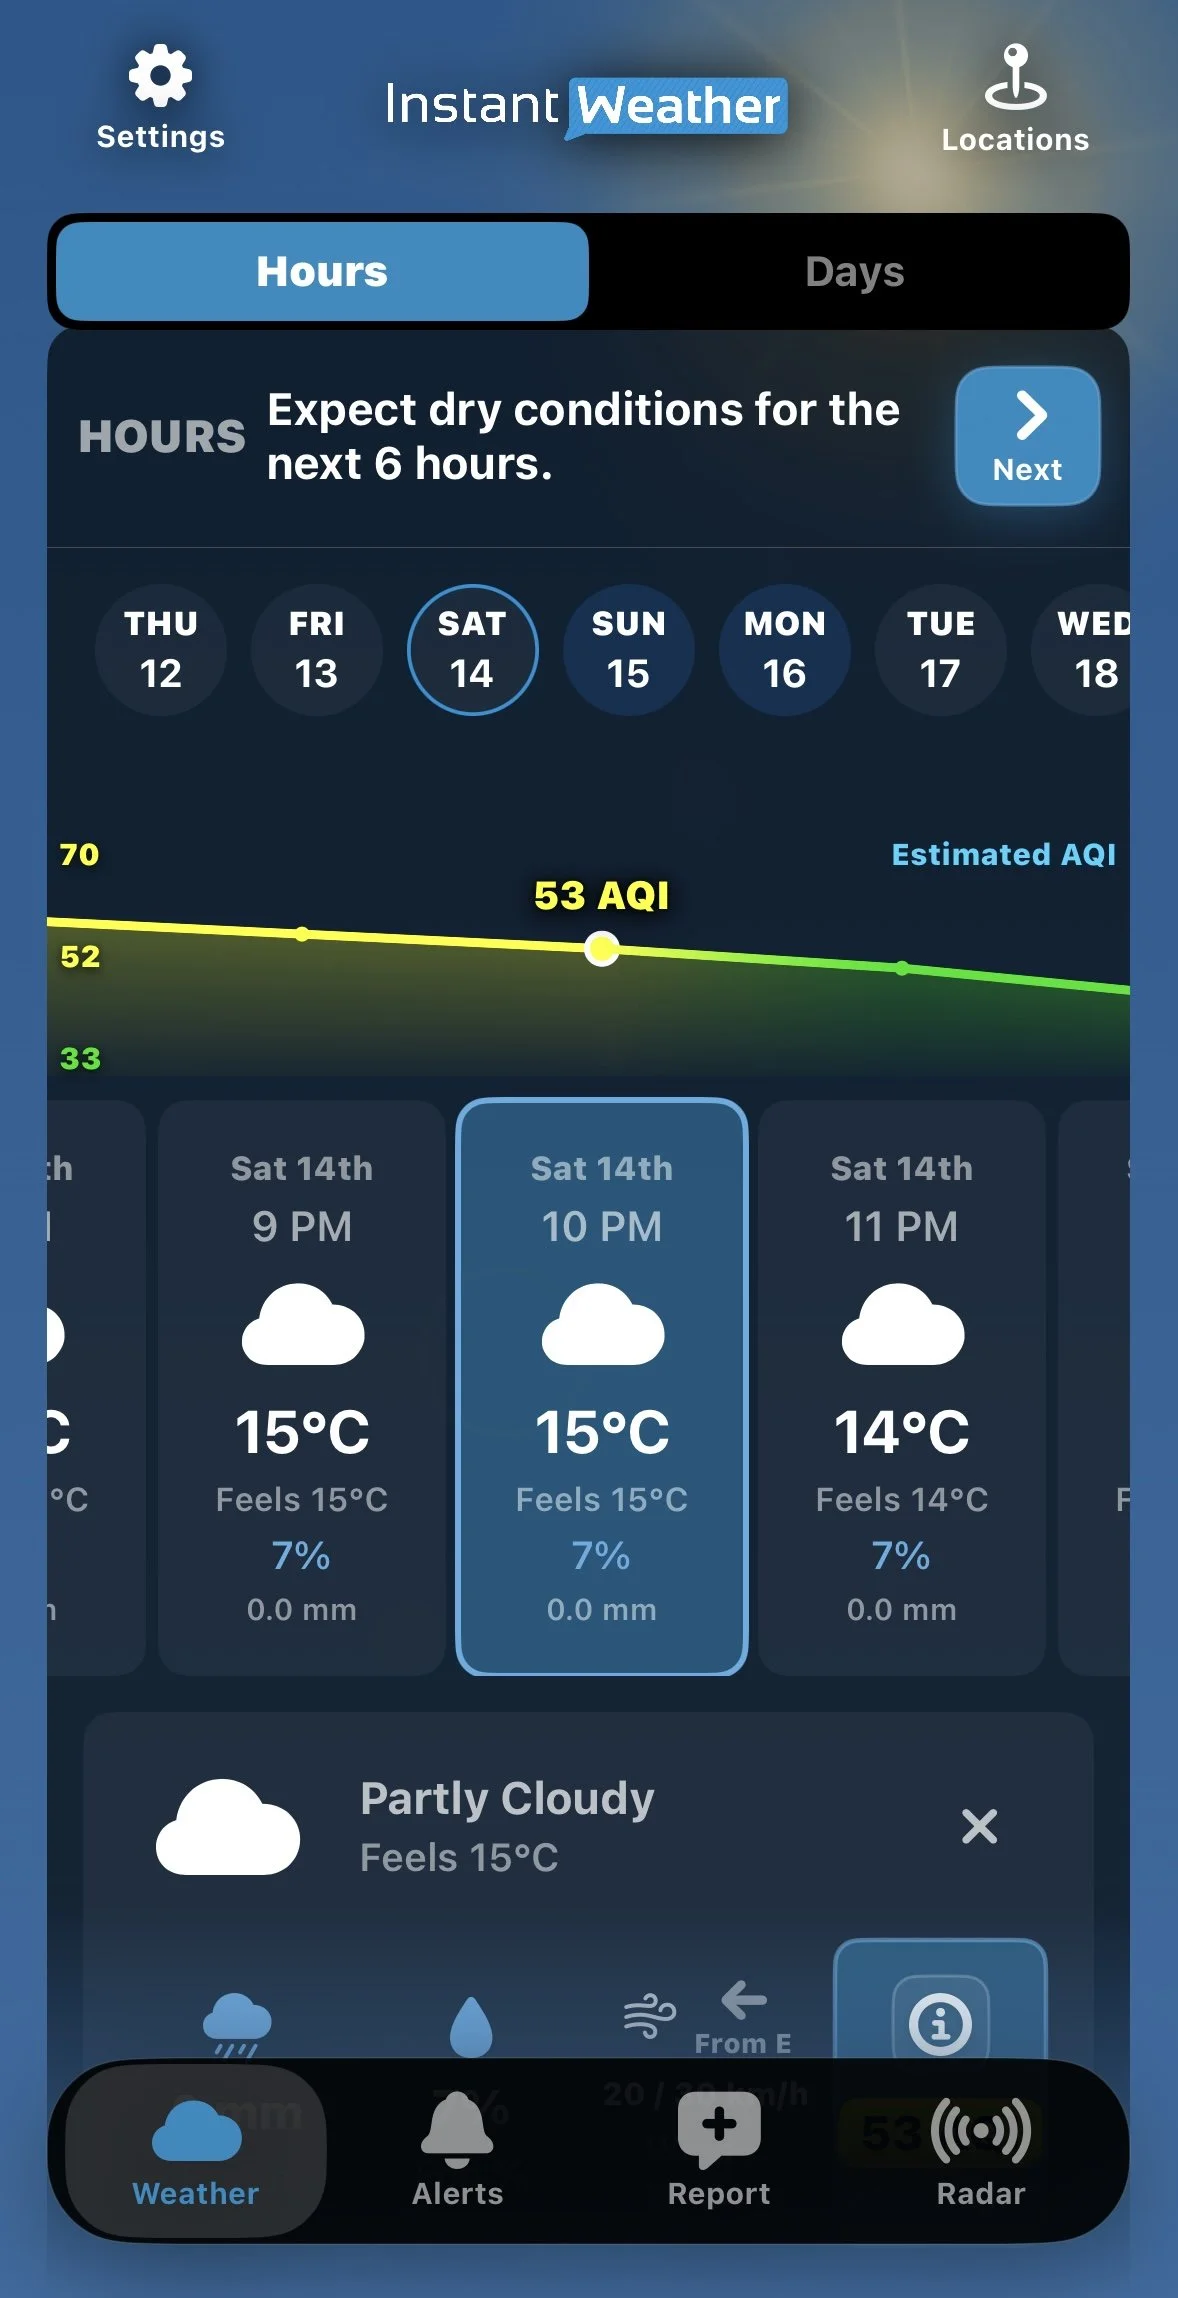
Tap Air Quality to display the Estimated AQI graph.

Scroll through the hourly forecast to see how air quality is expected to change. The graph changes colour as AQI levels rise or fall.

Hourly AQI Graph

3. Explore the Air Quality Map

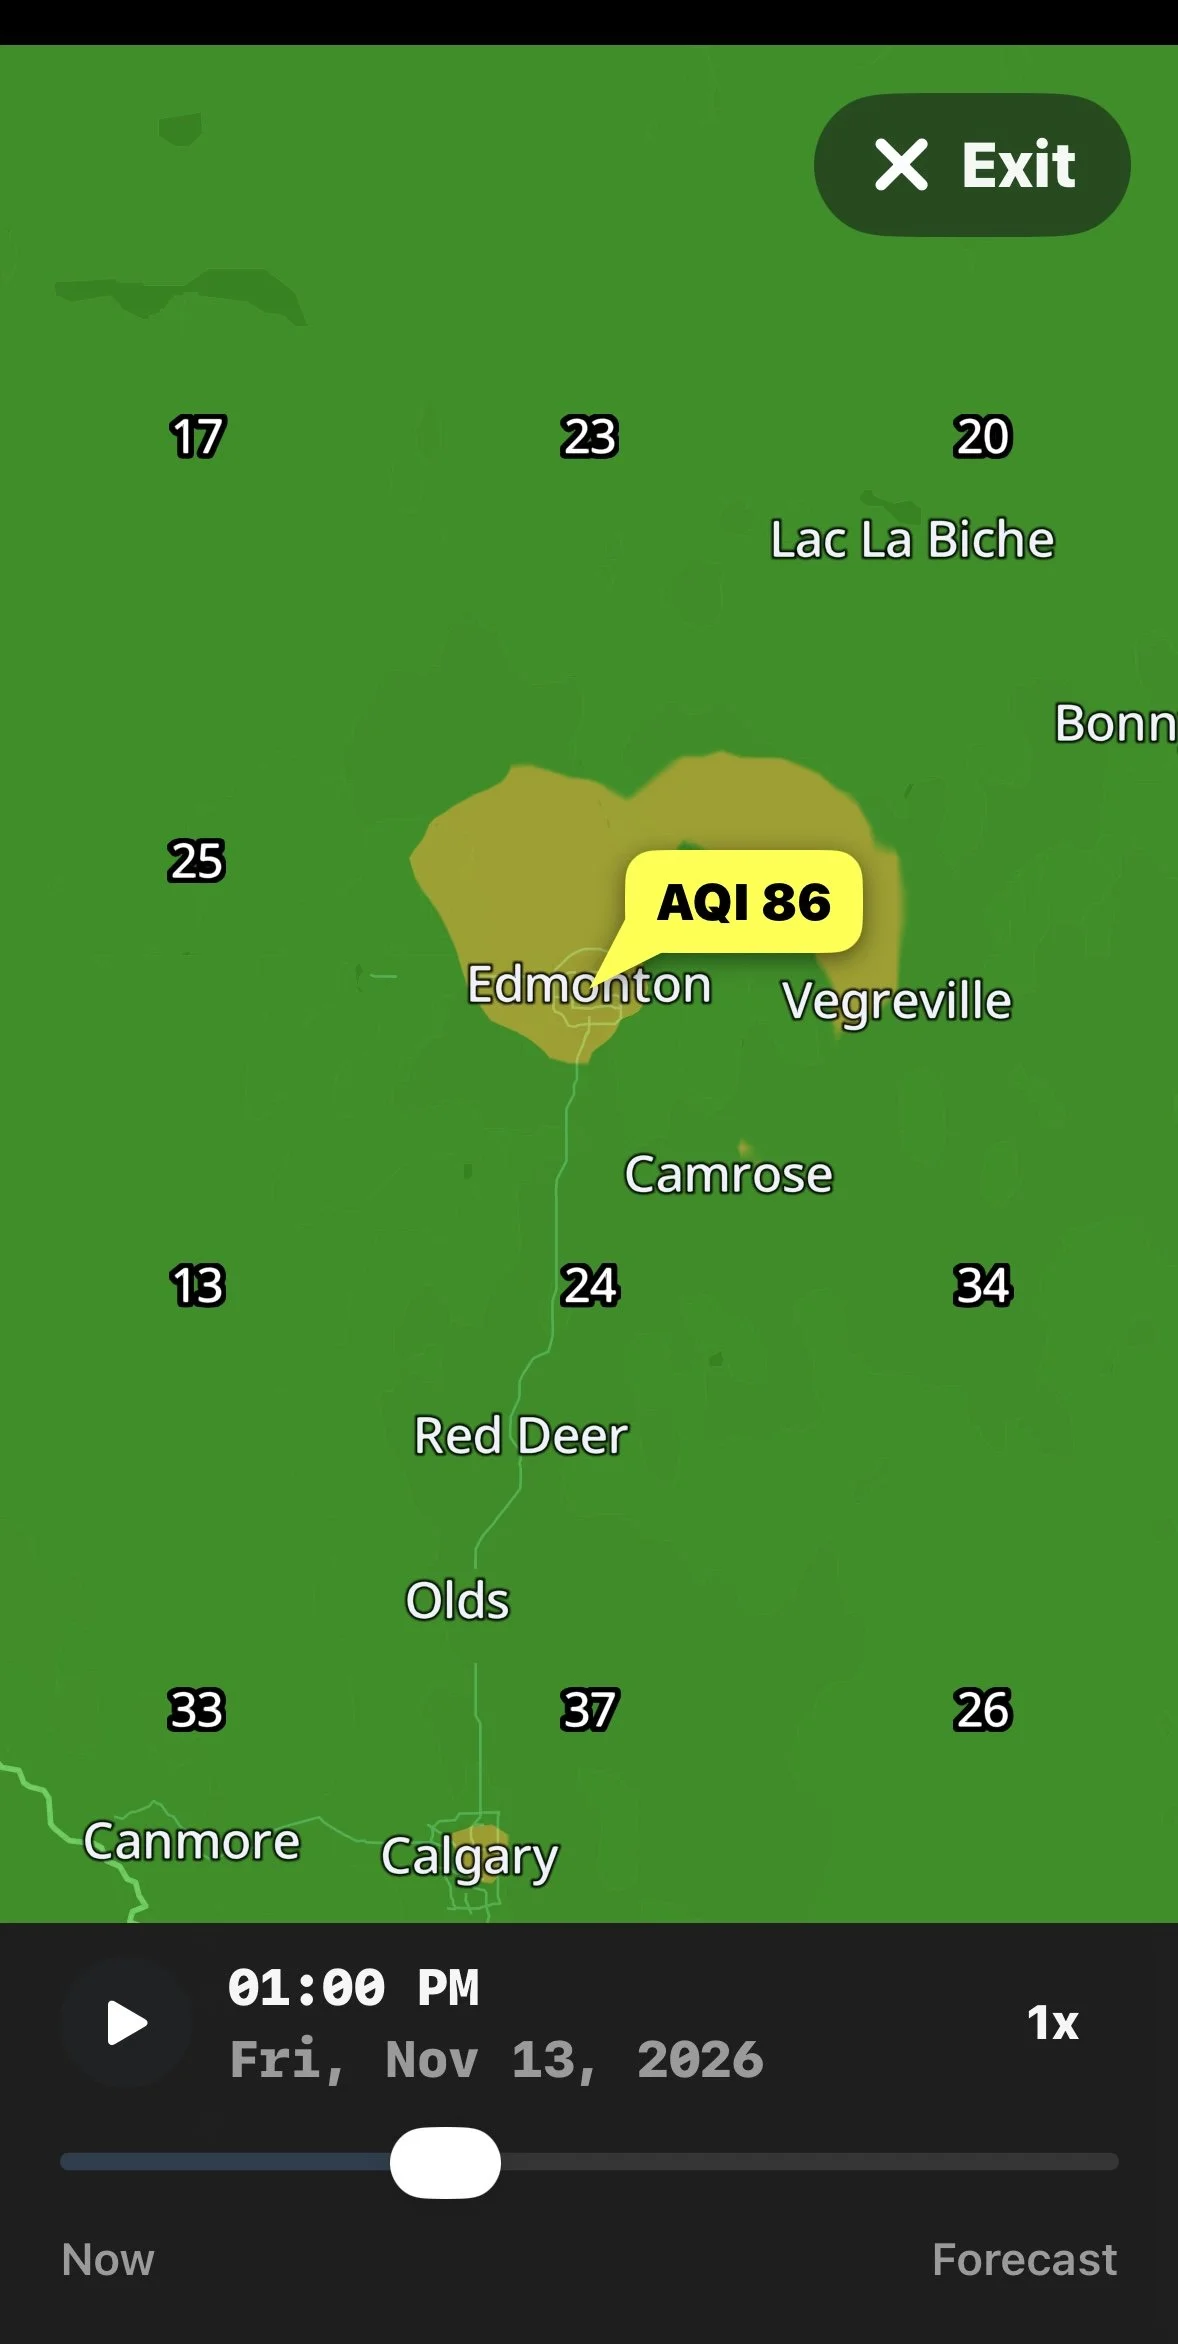
Tap an Air Quality value to open the detailed view, then tap the expand icon on the map.

You can explore air quality in surrounding areas, move through the forecast timeline or tap Play to animate changes.

Playback speeds of 1x, 2x and 4x are available.

Expanded Air Quality Map

Want to learn more? Continue reading for explanations of AQI colours and categories, air pollutants, monitoring stations, forecasts and map features.

Understanding the Air Quality Index (AQI)

The Air Quality Index is a numerical scale used to communicate air quality conditions and their potential health effects.

Lower AQI values indicate better air quality, while higher values indicate increasing levels of air pollution and potentially greater health concerns.

Instant Weather uses the following colour-coded AQI scale:

AQI Category Colour
0–50 Good Green
51–100 Moderate Yellow
101–150 Unhealthy for Sensitive Groups Orange
151–200 Unhealthy Red
201–300 Very Unhealthy Purple
301+ Hazardous Maroon

What Do the AQI Categories Mean?

Good (0–50)

Air quality is satisfactory, and air pollution poses little or no risk.

Moderate (51–100)

Air quality is acceptable, although some people who are unusually sensitive to air pollution may experience effects.

Unhealthy for Sensitive Groups (101–150)

People who are more sensitive to air pollution, including those with certain heart or lung conditions, may experience health effects.

Unhealthy (151–200)

Some members of the general public may experience health effects, while sensitive individuals may experience more serious effects.

Very Unhealthy (201–300)

Health alert conditions. The risk of health effects is increased for everyone.

Hazardous (301+)

Health warning of emergency conditions. Everyone is more likely to be affected.

For Canadian users: Instant Weather displays the AQI scale shown above, which is different from Canada's Air Quality Health Index (AQHI). The AQHI generally uses a scale from 1 to 10+ to communicate health risks associated with air pollution. The two scales should not be compared directly.

Viewing Current Air Quality Conditions

The current AQI reading appears in the expanded weather details on the Weather page.

Tap the Air Quality reading to open the detailed Air Quality window.

Understanding Current Observations

When current air quality observations are available, the detailed view may include:

  • The current AQI value and category.

  • The closest air quality monitoring station.

  • The distance to the monitoring station.

  • The date and time of the observation.

  • A map showing the monitoring station and surrounding area.

  • Information about individual air pollutants.

Current Air Quality Observation

Air quality monitoring stations are not located in every community. The closest available observation may come from a station some distance away.

Because air quality can vary geographically, the reading may not represent the exact conditions at your location.

Why Does Air Quality Sometimes Show "Data Unavailable"?

Current AQI readings depend on the availability of recent observations from monitoring stations.

If no recent station observation is available near the selected location, the app may display Data unavailable.

For example, the app may indicate that no recent station observation was found within 100 km.

This does not necessarily mean forecast information is unavailable. You may still be able to explore future air quality conditions using the forecast timeline.

Viewing Hourly Air Quality Forecasts

Instant Weather provides estimated air quality information for upcoming forecast periods.

How to View the AQI Graph

  1. Open the Hours section of the Weather page.

  2. Tap Details and more products beneath the hourly forecast, or tap an individual forecast period.

  3. Select Air Quality in the expanded details.

  4. The graph will display Estimated AQI.

  5. Scroll horizontally through the forecast periods to explore changing conditions.

The selected forecast period is highlighted, and its estimated AQI value appears on the graph.

Understanding the Colour-Changing Graph

The AQI graph uses colours corresponding to the air quality categories described above.

As forecast values increase or decrease, the graph changes colour to reflect the expected air quality conditions.

This makes it easier to identify periods when air quality may improve or deteriorate without examining every individual value.

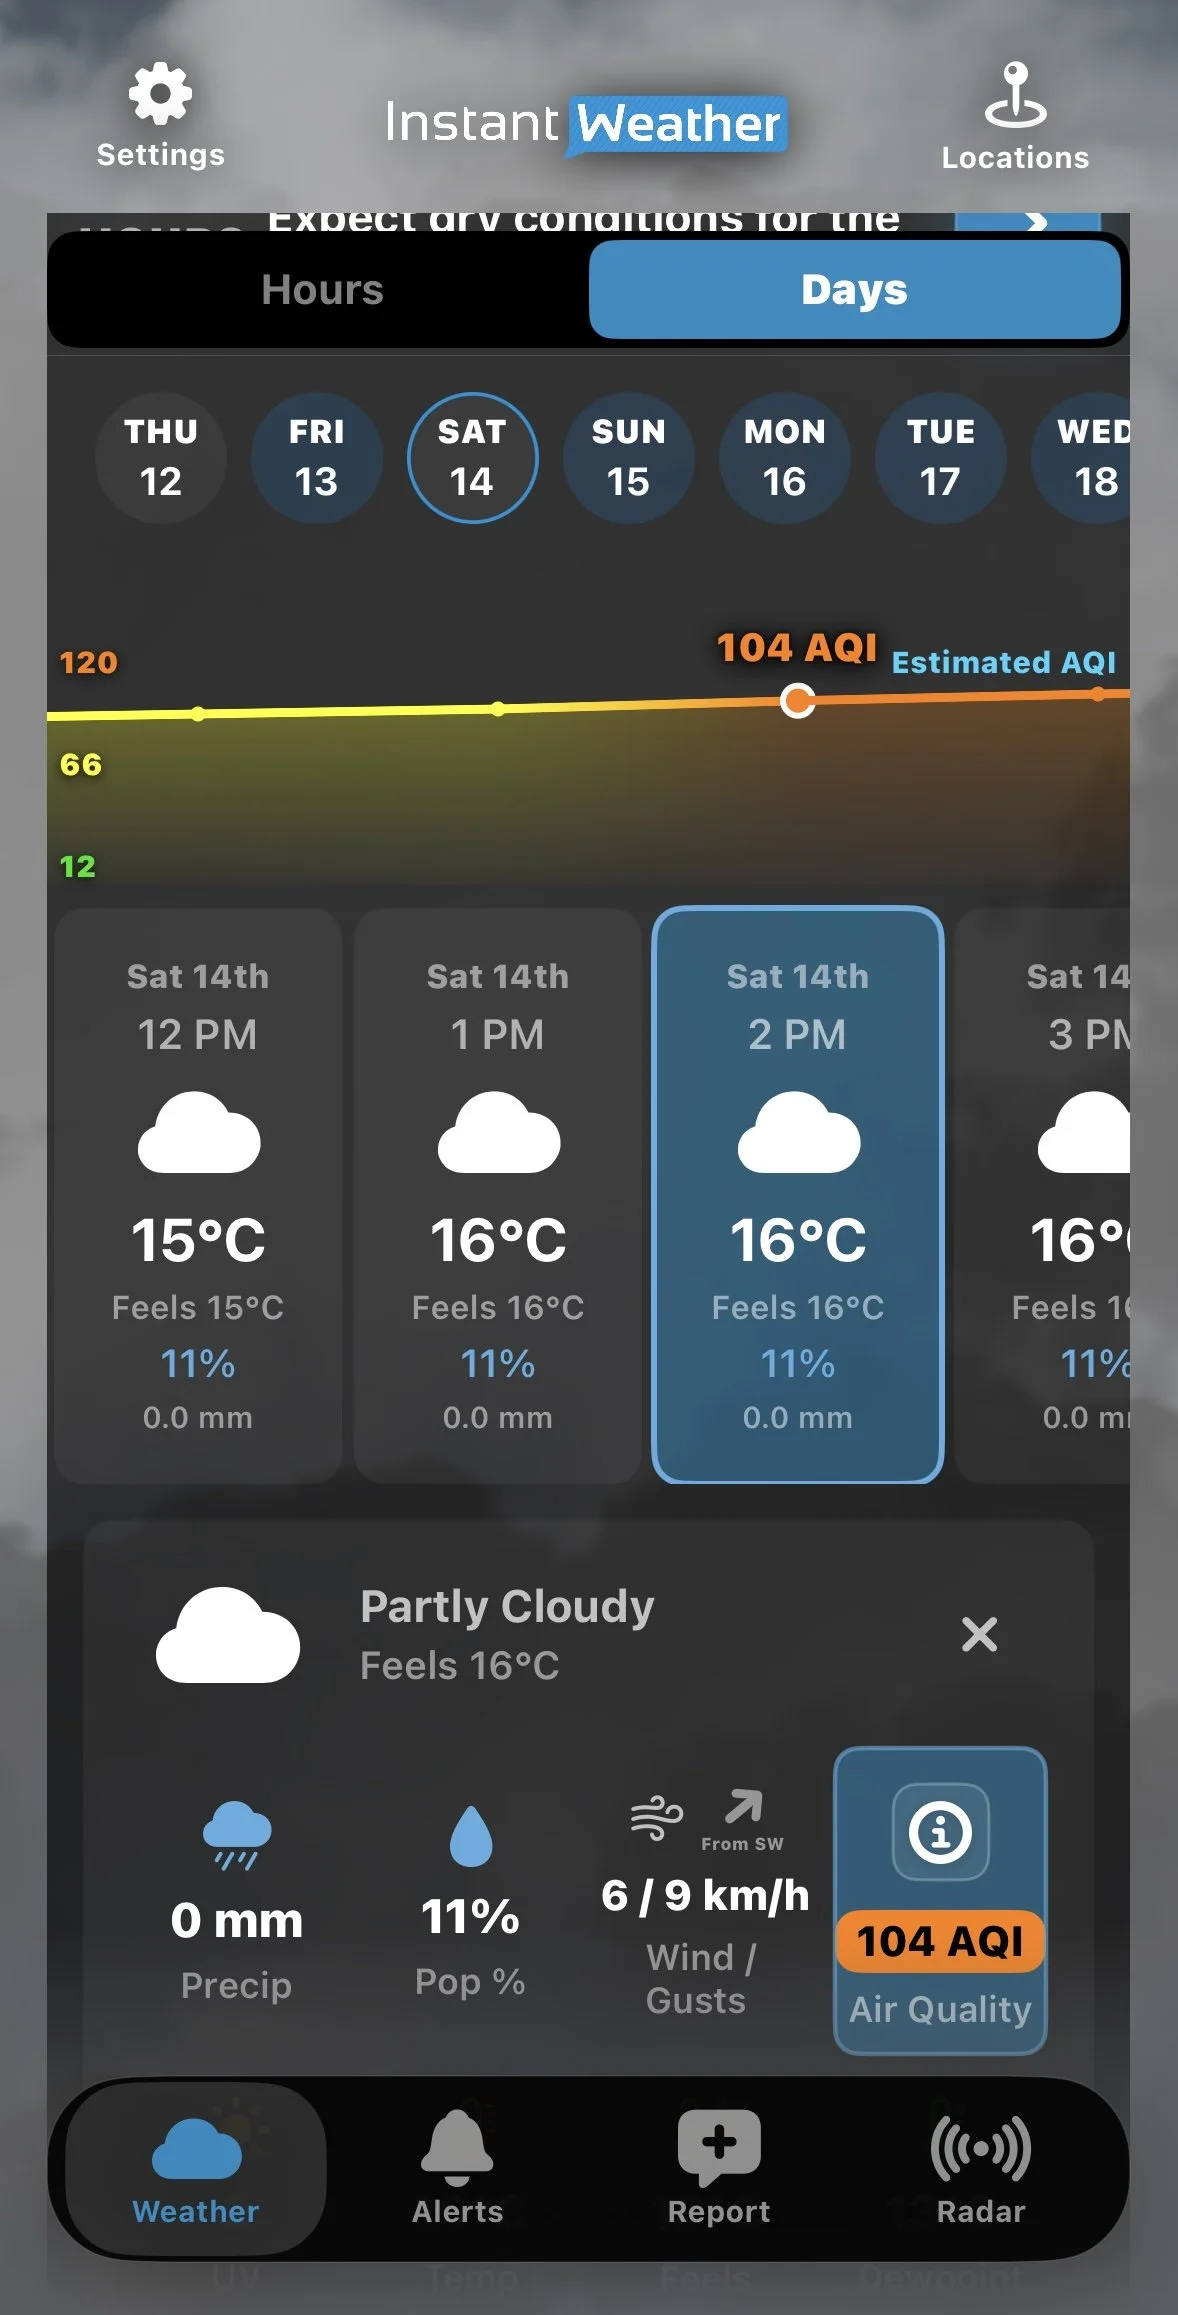
Higher AQI Forecast

The graph displays Estimated AQI because these values are forecasts rather than actual observations.

You can also scroll through the forecast to explore later periods.

Exploring the Interactive Air Quality Map

The Air Quality map provides a visual representation of air quality conditions across a region.

It can be particularly useful during wildfire smoke events or when pollution affects some communities more than others.

Opening the Map

  1. Tap an Air Quality reading in the current conditions or hourly forecast details.

  2. The detailed Air Quality window will open.

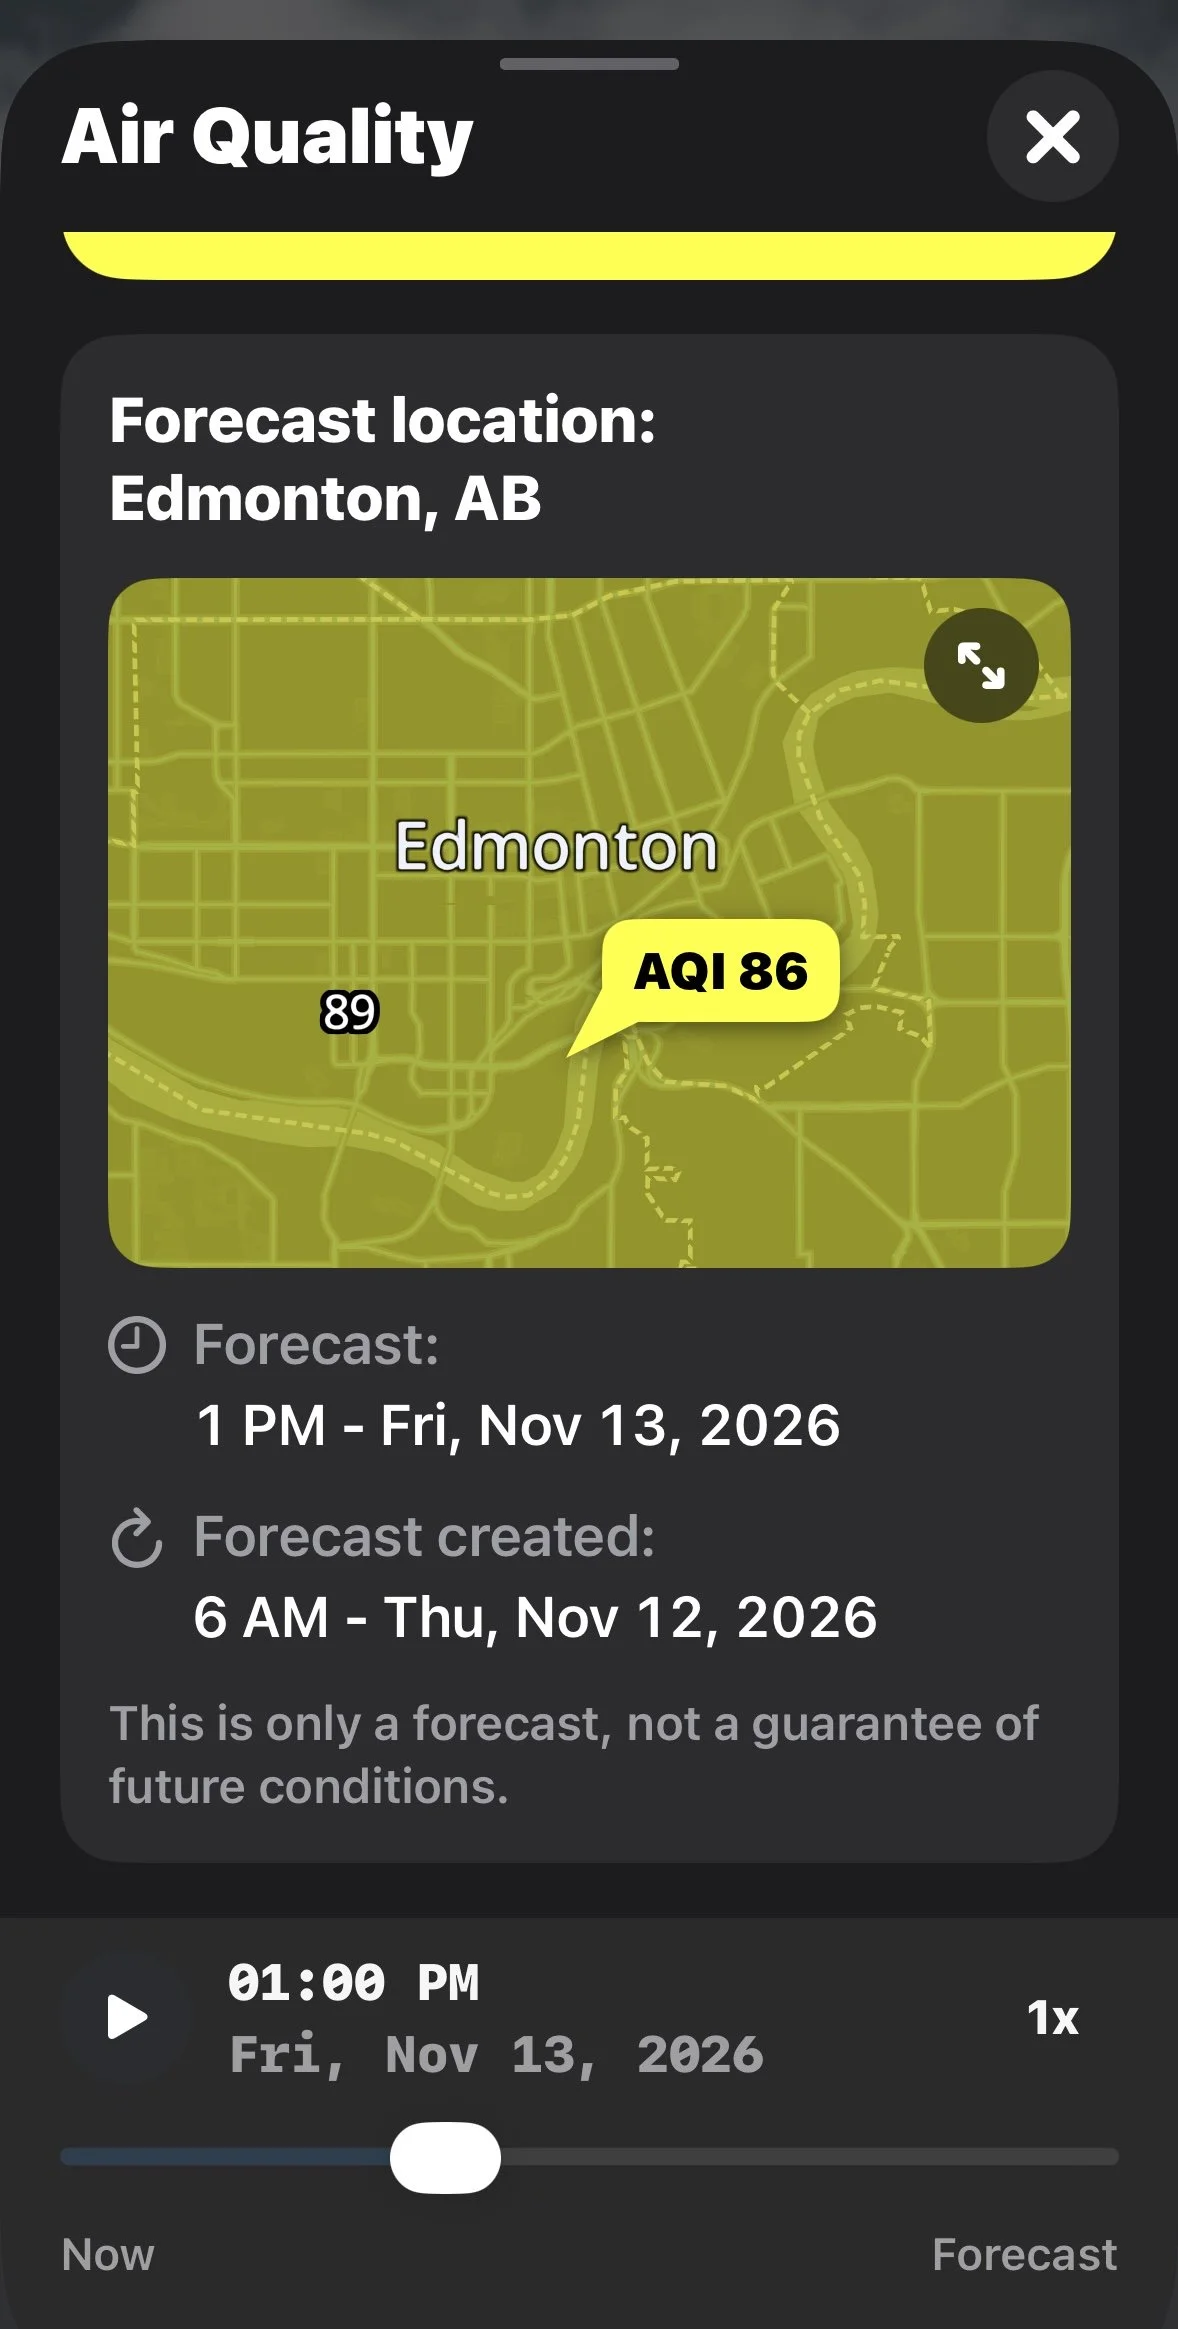
  3. Find the map showing the monitoring station or forecast location.

  4. Tap the expand icon in the upper-right corner to open a larger map.

Understanding the Map

The map uses colours corresponding to AQI categories.

For example, areas with Good air quality may appear green, while areas experiencing Moderate conditions may appear yellow.

Numerical AQI values may also appear at different locations on the map.

You can explore surrounding areas to compare air quality conditions between communities.

Viewing Future Air Quality Conditions

Instant Weather provides air quality forecasts extending approximately three days into the future.

The detailed Air Quality window includes a timeline and playback controls.

You can:

  • Move the timeline slider to select a different forecast time.

  • Tap Play to animate changes in air quality over time.

  • Adjust the playback speed to 1x, 2x or 4x.

  • Expand the map to explore conditions across a larger area.

As you move through the forecast, the map changes to reflect the predicted conditions for the selected time.

Air Quality Forecast Details

Forecasts can help you plan outdoor activities, but actual air quality conditions may differ from predictions.

Understanding Individual Air Pollutants

The detailed Air Quality window also provides information about individual pollutants that can affect air quality.

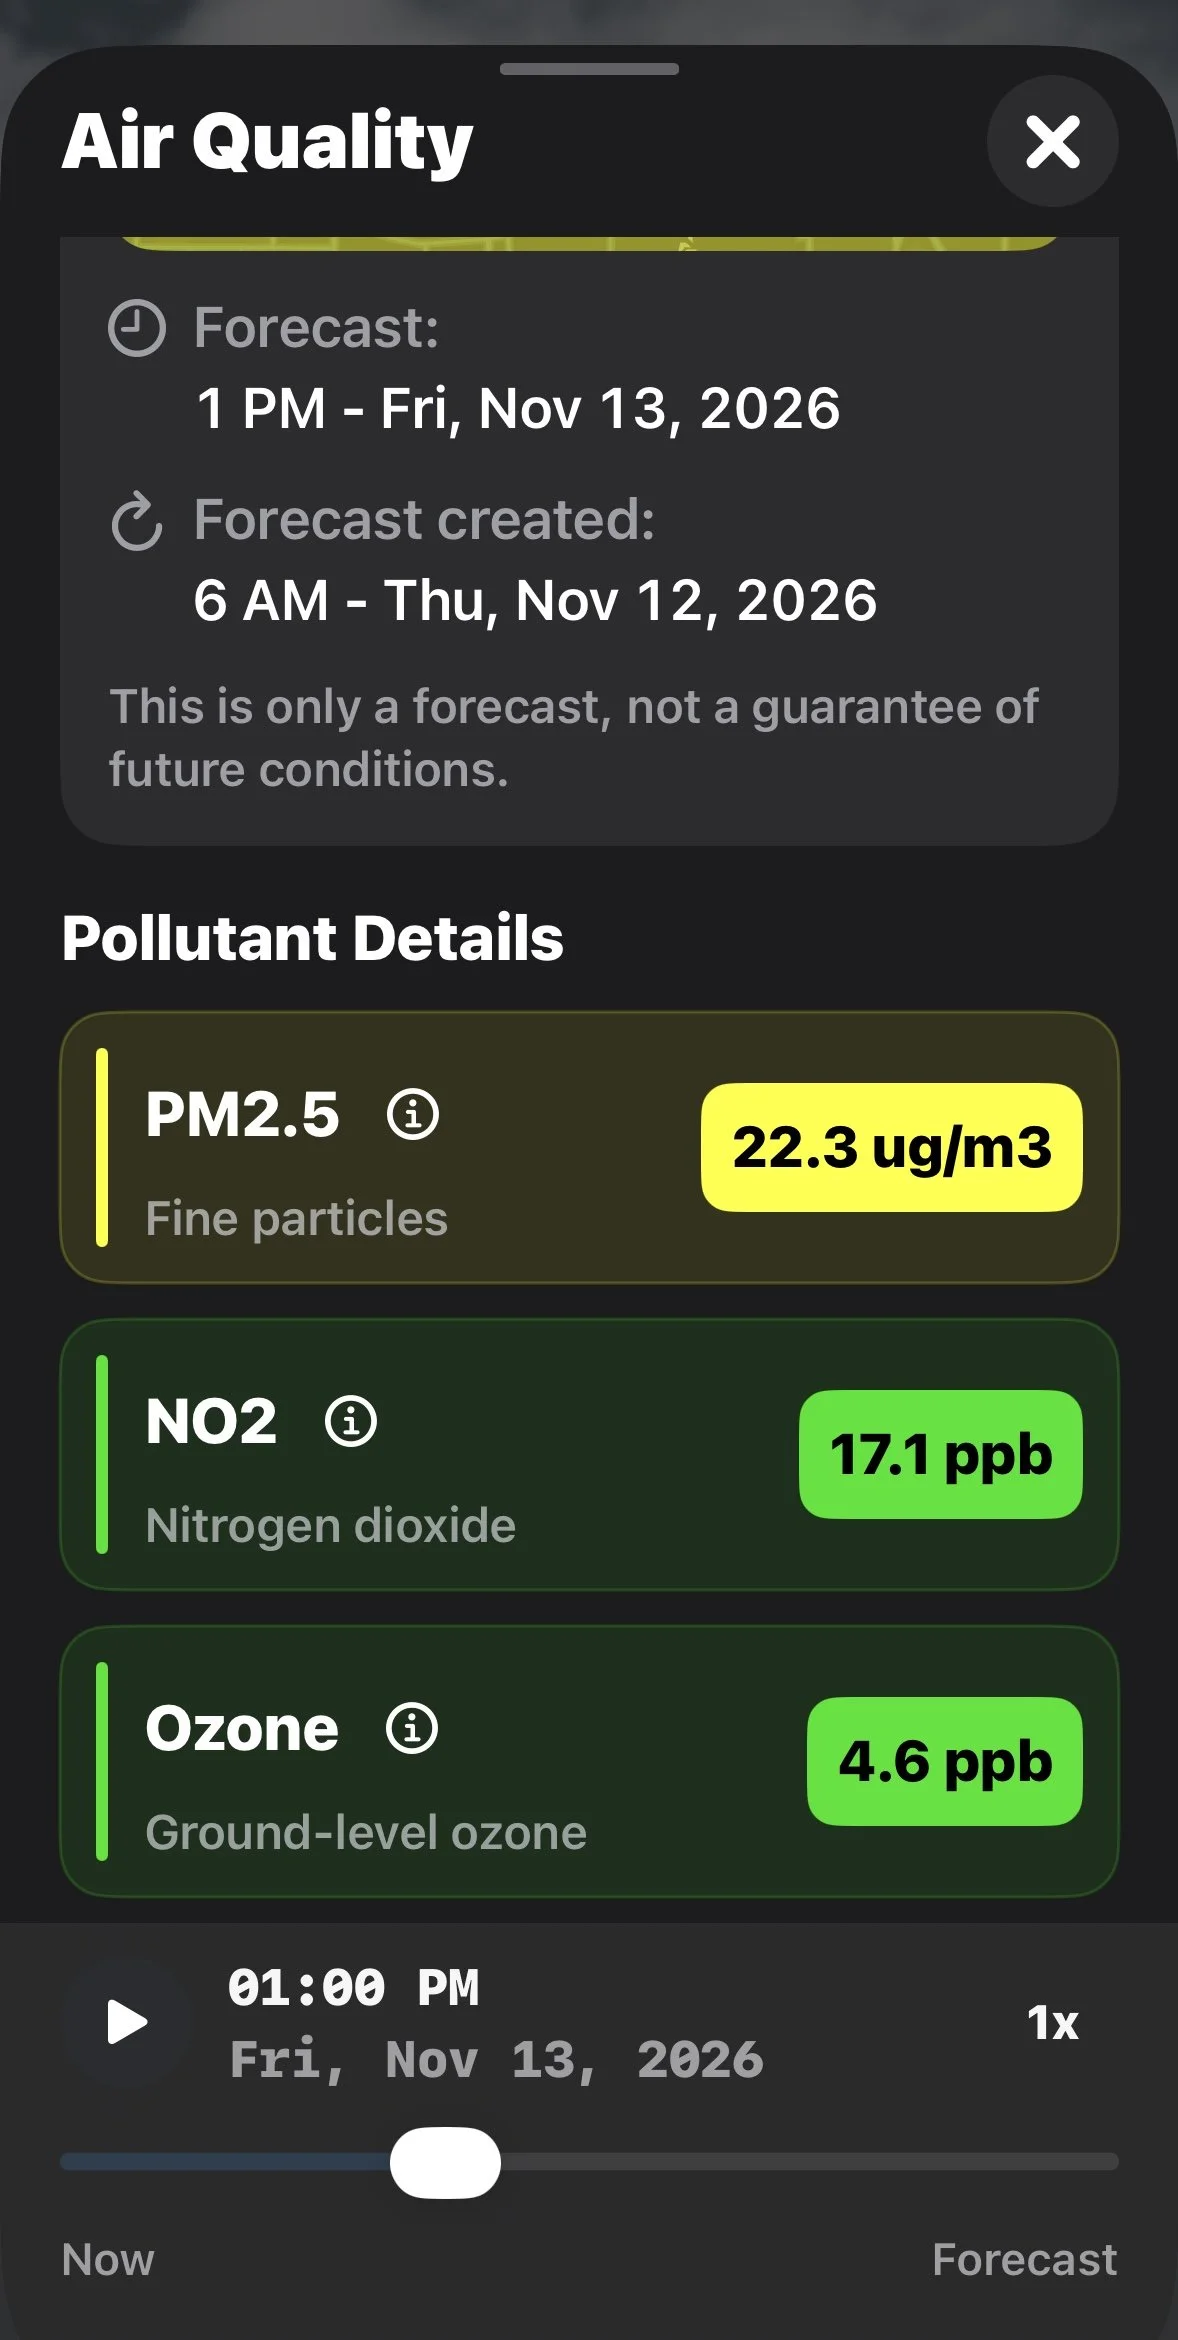
Instant Weather displays information for three pollutants.

PM2.5: Fine Particulate Matter

PM2.5 consists of extremely small airborne particles with diameters of 2.5 micrometres or less.

Sources include wildfire smoke, vehicle emissions, industrial activities and other forms of combustion.

These particles can travel deep into the lungs and may affect respiratory and cardiovascular health.

PM2.5 concentrations are displayed in µg/m³ (micrograms per cubic metre).

NO₂: Nitrogen Dioxide

Nitrogen dioxide is a gas produced primarily by burning fuel.

Common sources include vehicle exhaust, industrial processes and power generation.

Elevated concentrations can irritate the respiratory system, particularly for people with asthma or other respiratory conditions.

NO₂ concentrations are displayed in ppb (parts per billion).

Ozone: Ground-Level Ozone

Ground-level ozone forms when certain pollutants react in sunlight.

Higher concentrations can irritate the respiratory system and contribute to breathing difficulties.

Ground-level ozone is different from the protective ozone layer high in the atmosphere.

Ozone concentrations are displayed in ppb (parts per billion).

How Do These Pollutants Affect the AQI?

Instant Weather states that its AQI is estimated using the highest score among PM2.5, nitrogen dioxide and ground-level ozone.

Tap the information icon beside an individual pollutant in the app to learn more about it.

Pollutant Details

Observed Air Quality vs. Forecast Air Quality

There are two types of air quality information available in the app.

Observed Air Quality

Observed readings are based on measurements collected by air quality monitoring stations.

When available, the app identifies the closest monitoring station, its distance from your selected location and the time of the observation.

Forecast Air Quality

Forecast values are estimates of future air quality conditions.

The app displays the forecast location, the time being forecast and when the forecast was created.

Forecasts can help you plan outdoor activities, but actual conditions may differ from predictions.

Frequently Asked Questions

Why Is the AQI Different From Canada's AQHI?

The Air Quality Index (AQI) and Canada's Air Quality Health Index (AQHI) use different scales and methods.

Instant Weather displays AQI values ranging from Good (0–50) to Hazardous (301+).

Canada's AQHI generally uses a scale of 1 to 10+ and is designed to communicate health risks associated with air pollution.

The numerical values from these two systems should not be compared directly.

Why Is My Air Quality Reading From Another Community?

Air quality observations are collected at monitoring stations, which may not be located in every community.

The app identifies the closest available monitoring station and may display its distance from your selected location.

Why Does the AQI Graph Change Colour?

The graph uses colours corresponding to air quality categories.

As forecast values increase or decrease, the colours help illustrate changes in air quality conditions.

Why Does the Forecast AQI Differ From the Current Reading?

Current readings are based on observations, while forecast values are estimates of future conditions.

Differences can occur because of changing weather conditions, pollution sources, forecast uncertainty and the location of monitoring stations.

Can I View Air Quality in Other Communities?

Yes. You can select another location in Instant Weather to view available air quality information.

You can also explore the expanded Air Quality map to examine conditions across a larger geographic area.

How Accurate Are Air Quality Forecasts?

Air quality forecasts are estimates based on available information and forecast models.

Actual conditions may differ, particularly when air quality changes rapidly due to wildfire smoke or other pollution sources.

Why Monitoring Air Quality Matters

Air quality can change due to wildfire smoke, vehicle emissions, industrial pollution and weather conditions.

Poor air quality can affect anyone, but children, older adults and people with heart or lung conditions may be particularly sensitive.

Checking current conditions and upcoming forecasts can help you make informed decisions about outdoor activities.

During periods of poor air quality, follow recommendations from your local public health authorities.

Last updated: November 12, 2026

Back to Instant Weather Help Centre

Understanding the Radar in the Instant Weather App

The Instant Weather app provides several radar options to help you track precipitation, see how weather systems are moving, and explore forecasts of future precipitation.

This guide explains the different radar types, how to use the radar controls, how to interpret precipitation colours, and how to view weather alerts and Instant Updates directly on the map.

These instructions apply to the Updated Radar Page Style. You can select your preferred radar layout under Settings > Radar Page Style. If your radar screen looks different from the screenshots in this guide, check which page style you have selected.

On This Page

Accessing the Radar

Tap Radar in the navigation bar at the bottom of the Instant Weather app.

The radar map displays precipitation, along with controls for navigating the map and viewing past and future radar information.

Main Radar Screen

Choosing a Radar Type

Three radar options are available:

  • Raw Mosaic

  • Mosaic

  • Smooth Mosaic

You can switch between these options by opening Settings > Radar Source.

Raw Mosaic

Raw Mosaic displays radar imagery directly from Environment and Climate Change Canada (ECCC).

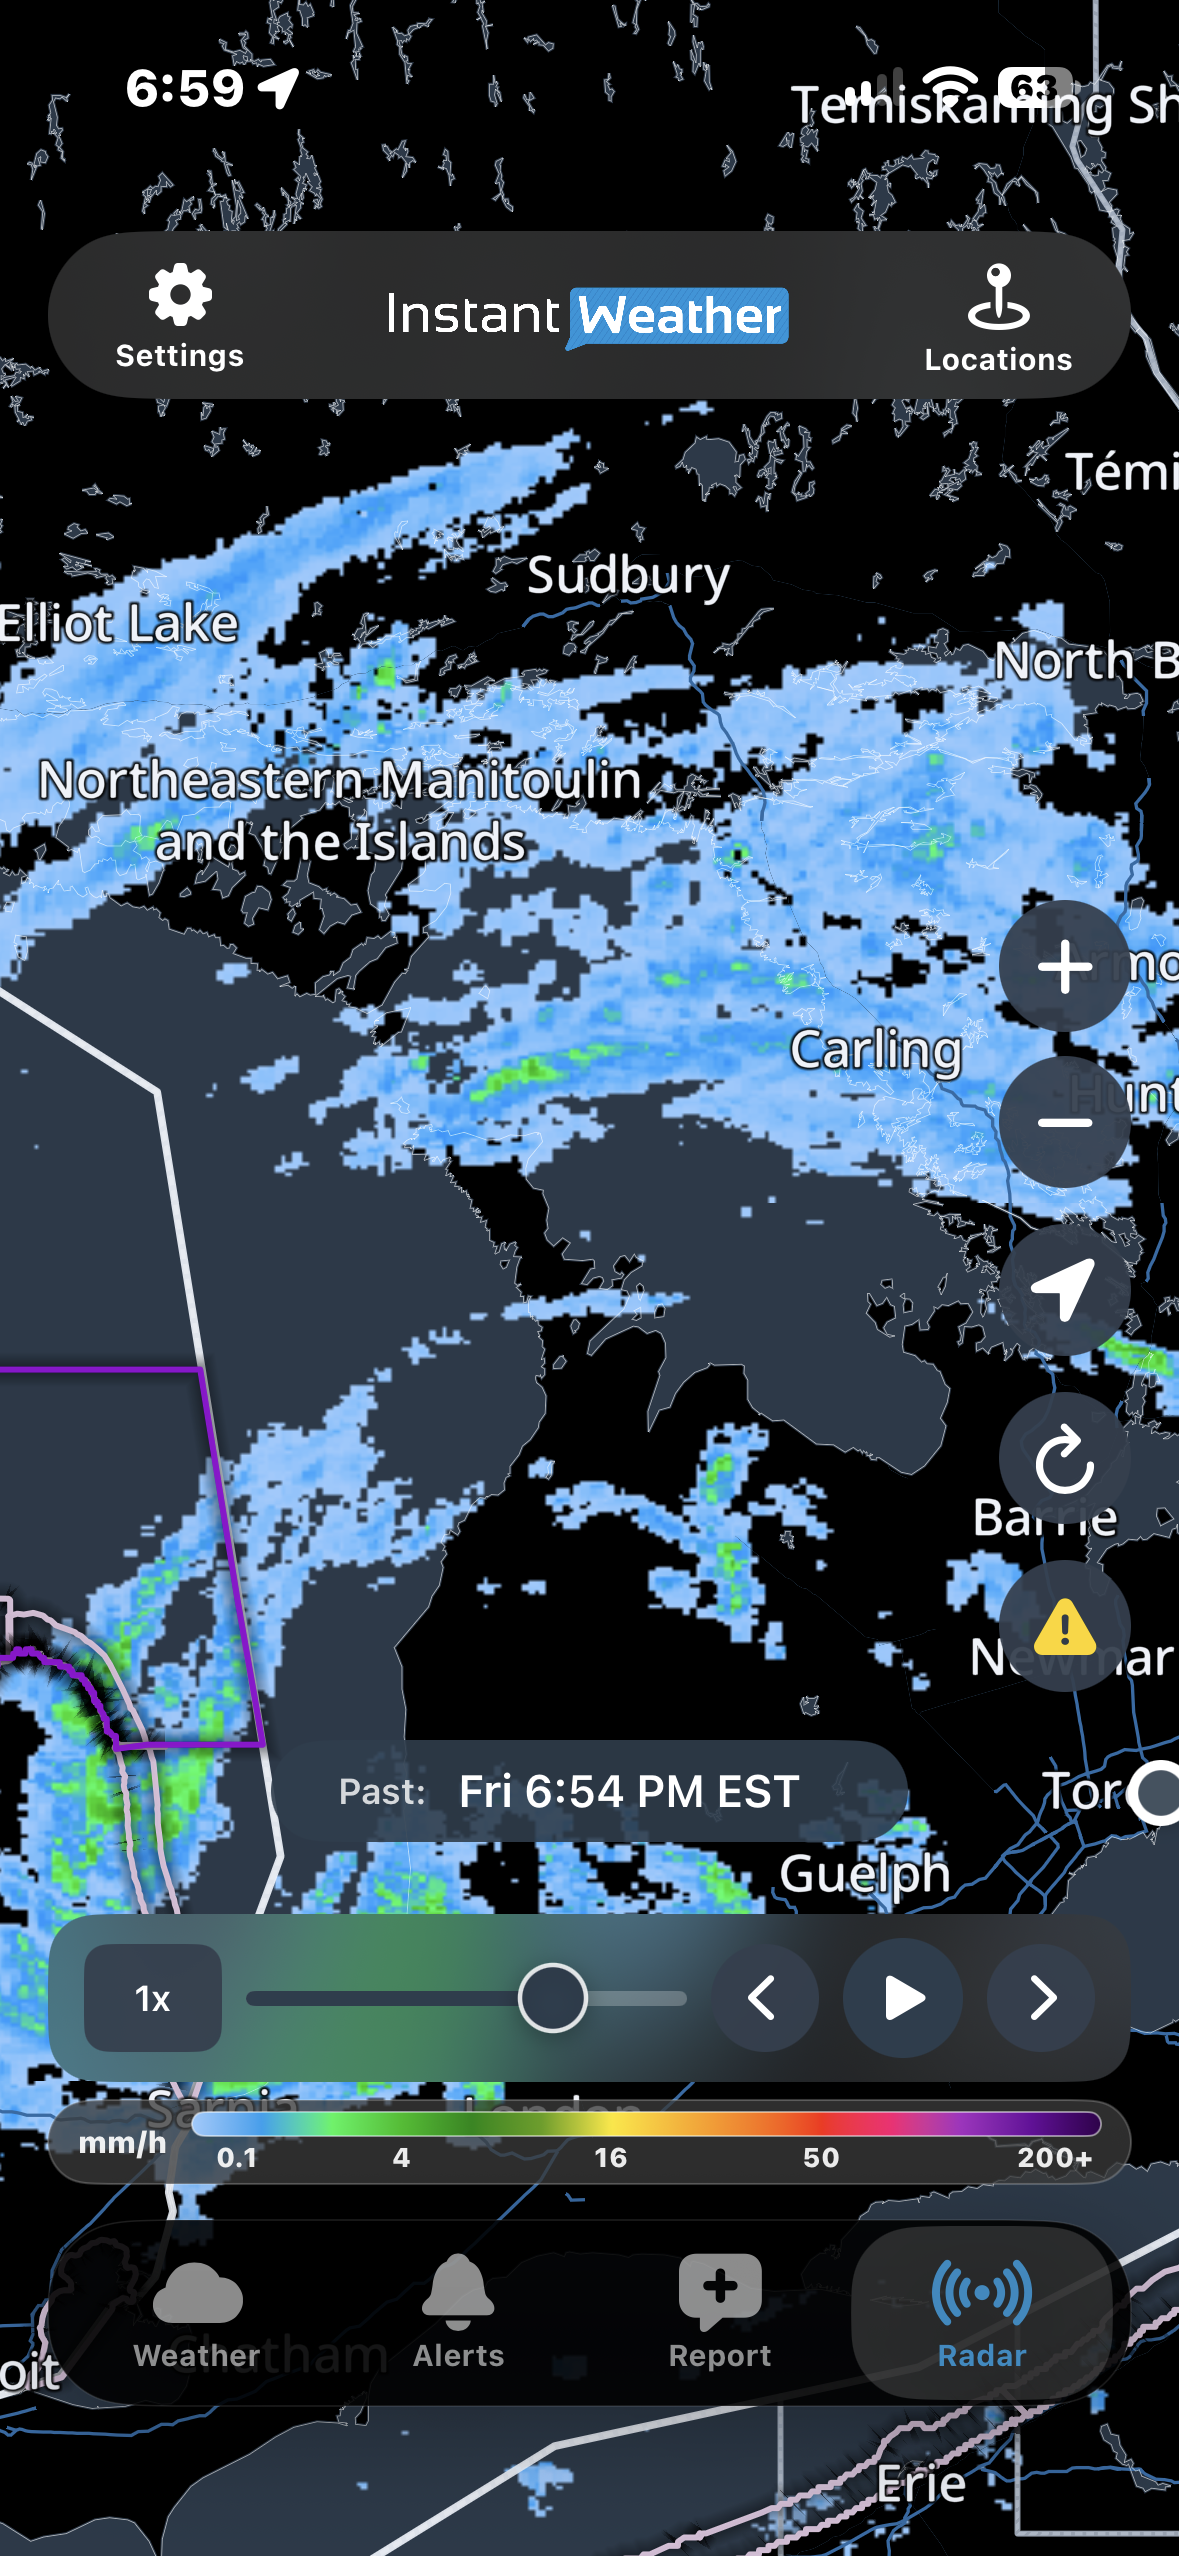
It shows precipitation intensity rather than precipitation type. The colour legend indicates precipitation rates in millimetres per hour (mm/h).

Raw Mosaic includes approximately:

  • 3 hours of past radar

  • 1 hour of future radar provided by Environment Canada

This provides a total of approximately four hours of radar information.

Raw Mosaic is useful for examining the location and intensity of precipitation using Environment Canada's radar imagery.

Raw Mosaic with Intensity Legend

Mosaic

Mosaic displays precipitation using colours that help distinguish rain, snow, freezing rain and mixed precipitation.

It includes both past radar observations and future radar forecasts, allowing you to follow precipitation as it moves through an area.

Mosaic displays radar information in individual frames, so the animation may appear less continuous than Smooth Mosaic.

Smooth Mosaic

Smooth Mosaic provides the same general precipitation information as Mosaic, but produces a smoother animation between radar frames.

This can make it easier to follow the movement of precipitation over time.

Both Mosaic and Smooth Mosaic use the same precipitation-type legend.

Understanding Radar Colours

The radar legend helps you interpret the colours displayed on the map.

Mosaic and Smooth Mosaic

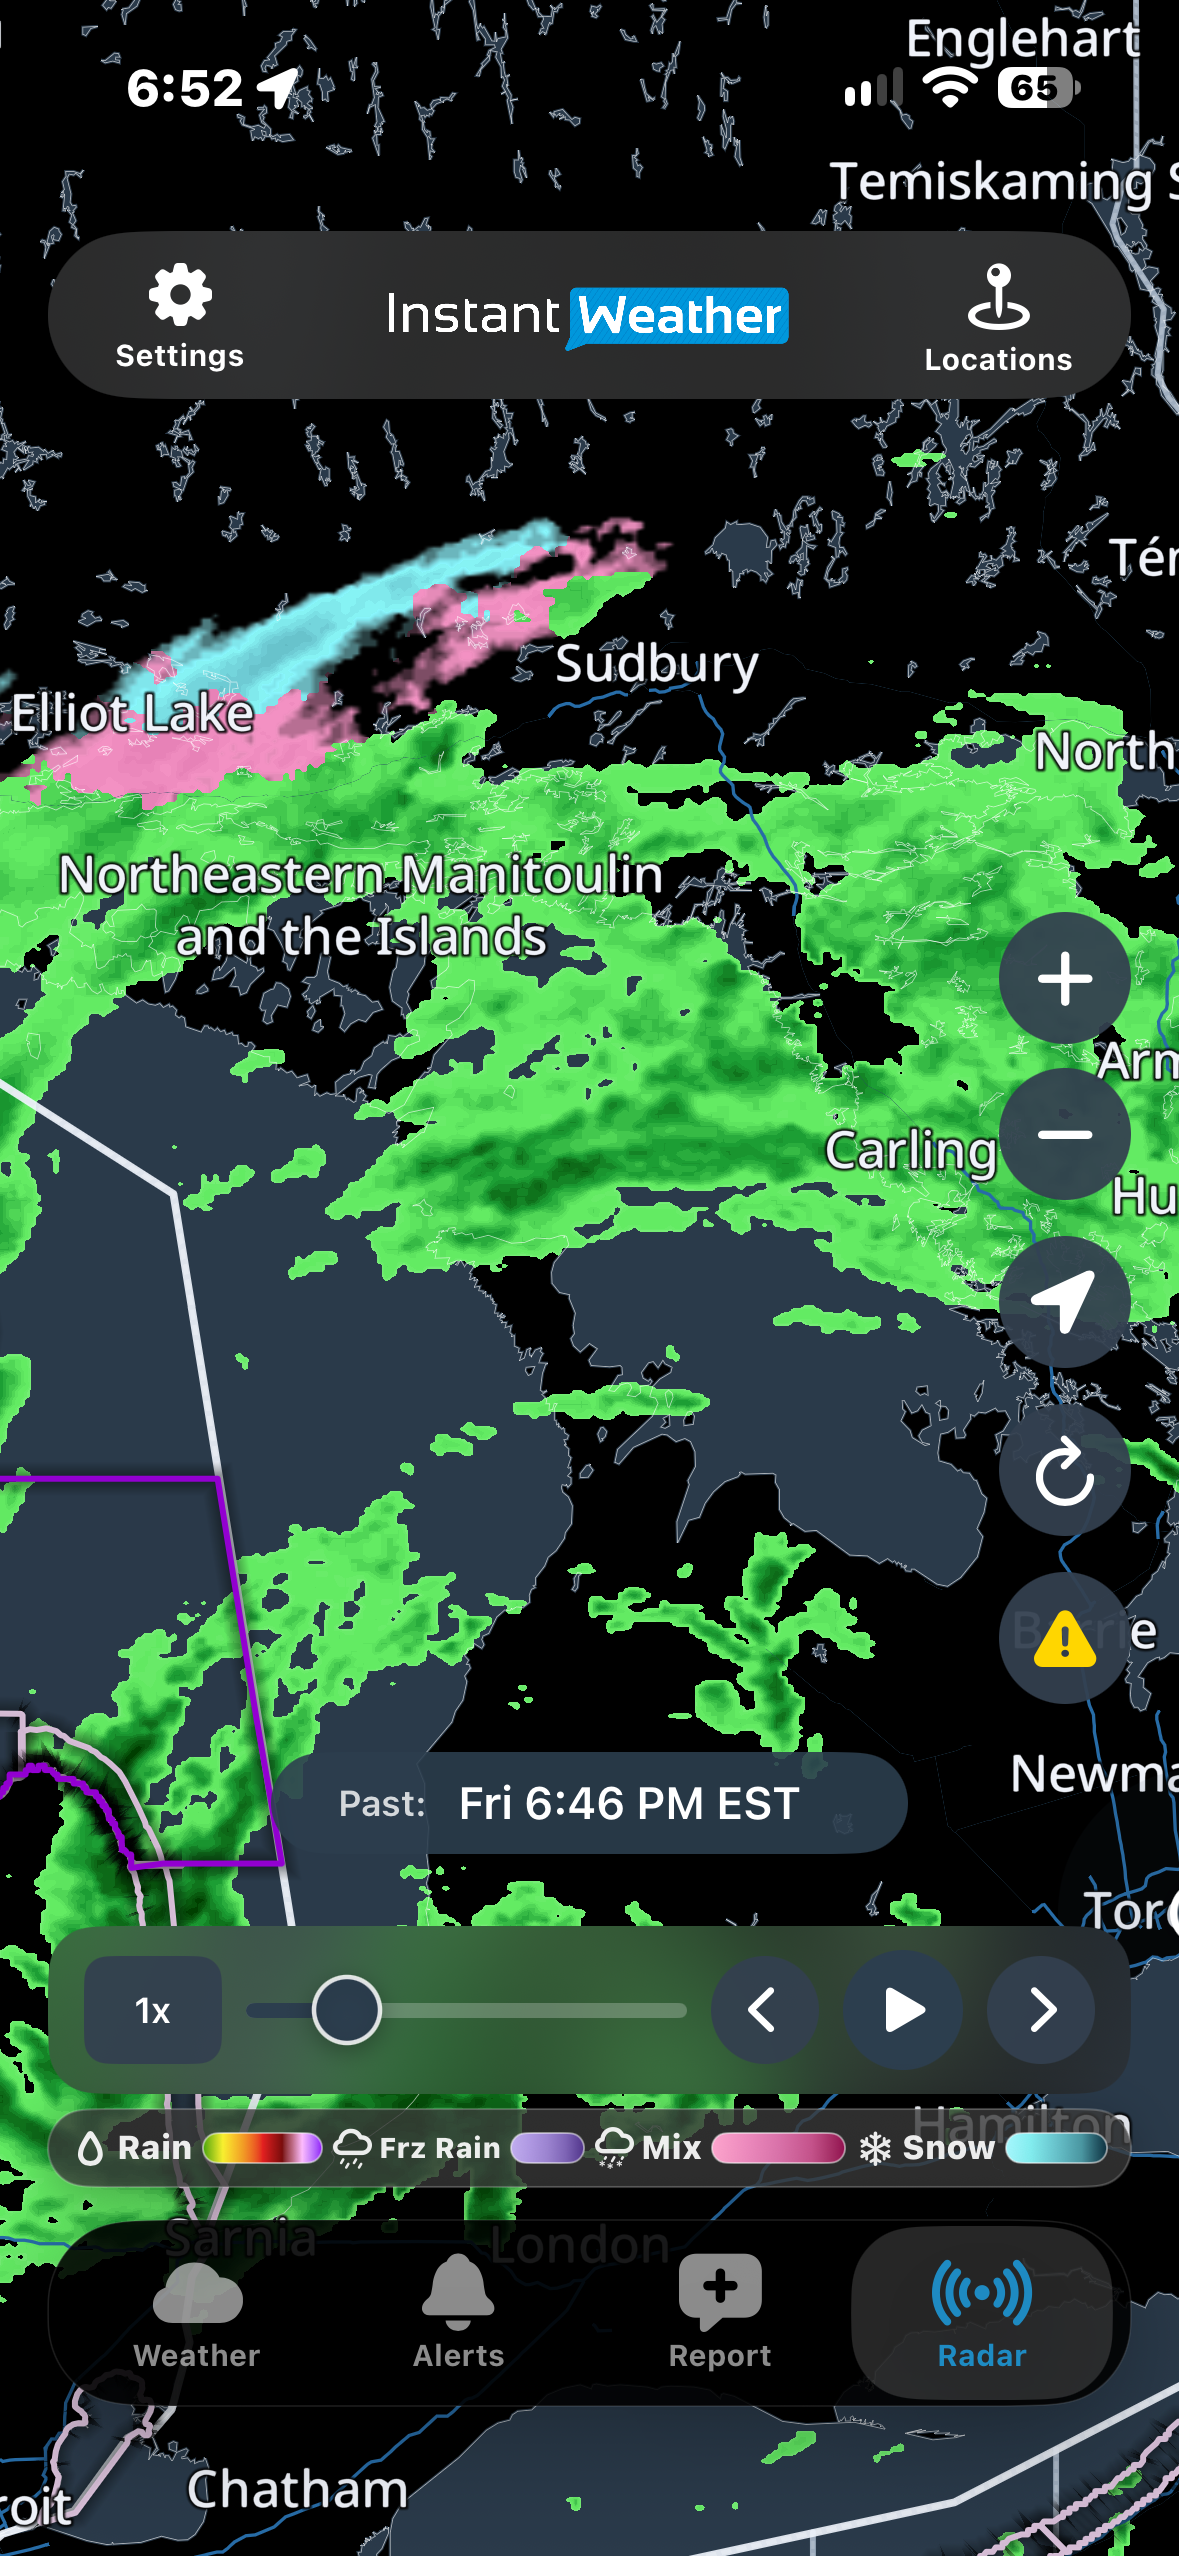
The legend identifies four precipitation types:

  • Rain: Colours range from green through yellow, orange and red, with green indicating lighter rain and red indicating heavier precipitation. White areas within intense red precipitation may indicate hail.

  • Freezing rain: Purple shades.

  • Mixed precipitation: Pink shades.

  • Snow: Light blue to cyan shades.

Colour variations within each category help indicate precipitation intensity.

The introductory screenshot shows rain, mixed precipitation and snow occurring close together around Sudbury and Manitoulin Island.

Raw Mosaic

Raw Mosaic uses a precipitation intensity scale rather than identifying precipitation types.

Its legend displays precipitation rates in mm/h, with higher values indicating more intense precipitation.

Always check the legend for the selected radar type, since the colours have different meanings in Raw Mosaic and the other radar options.

Using the Radar Timeline

The timeline at the bottom of the radar map allows you to view past radar observations and future radar forecasts.

Playing and Pausing Radar

Tap Play to animate the radar.

The animation shows how precipitation has moved and how it is forecast to move.

Tap Pause to stop the animation.

Moving Through Radar Frames

You can also navigate the radar manually:

  • Timeline slider: Drag the slider to move to a particular time.

  • Back arrow: Move backward one radar frame.

  • Forward arrow: Move forward one radar frame.

Radar frames generally advance in six-minute increments.

When moving quickly through the timeline, images may briefly appear blurry while radar data loads.

Adjusting Playback Speed

Tap the playback speed control, such as 1x, to change the animation speed.

Slower speeds allow you to examine changes more carefully, while faster speeds help you review longer periods of radar activity.

Past and Future Radar

The time displayed above the timeline indicates whether you are viewing past or future radar information.

Past radar shows previously observed precipitation.

Future radar shows forecast precipitation and how it may move or develop.

Future radar is a forecast, so actual conditions may differ.

Radar Map Controls

Several buttons along the side of the radar map help you navigate and customize the display.

Zoom In and Out

Tap + to zoom in or − to zoom out.

You can also use touch gestures to zoom and move around the map to examine different areas.

Centre on Your Location

Tap the location button to centre the radar map on your current location.

  • iPhone and iPad: The button displays a location arrow.

  • Android: The button displays a crosshair symbol.

Your device may need location permissions enabled for this feature to work.

Refresh Radar

Tap the Refresh button to reload radar information and return to the latest available observed radar frame.

Show or Hide Weather Alerts and Instant Updates

Tap the yellow warning triangle to show or hide weather alert and Instant Update outlines on the radar map.

These outlines identify areas affected by official weather alerts or Instant Updates.

Turning them off can make it easier to examine precipitation without additional map overlays.

Saved Locations

Tap Locations at the top of the screen to access your saved locations and select an area to view.

Viewing Weather Alerts and Instant Updates on the Radar

The radar map displays outlined areas for official weather alerts issued by government weather agencies in Canada and the United States, as well as Instant Updates from Instant Weather.

Instant Weather does not issue official weather alerts. Official alerts are issued by government weather agencies. Instant Weather provides its own updates and forecasts to help keep you informed about developing weather conditions.

Understanding Alert Outline Colours

Canadian weather alerts

Environment and Climate Change Canada (ECCC) uses colour-coded alert levels, including yellow, orange and red, to indicate the level of risk associated with a weather event.

The alert outlines on the radar map reflect these levels.

United States weather alerts

In the United States, alert outline colours may vary according to the type of weather alert.

For example, flood-related alerts may appear green, frost advisories blue and gale warnings purple.

This means that alert outline colours may have different meanings depending on whether the alert was issued in Canada or the United States.

Instant Updates

Instant Weather also provides its own Instant Updates to share information about significant weather conditions.

These may include areas where our team has identified possible storm rotation or other notable weather hazards that may not be covered by an official government alert.

Instant Updates may also appear as outlined areas on the radar map.

Viewing Alert Details

To view details about a weather alert or Instant Update:

  1. Make sure alert outlines are enabled using the yellow warning triangle.

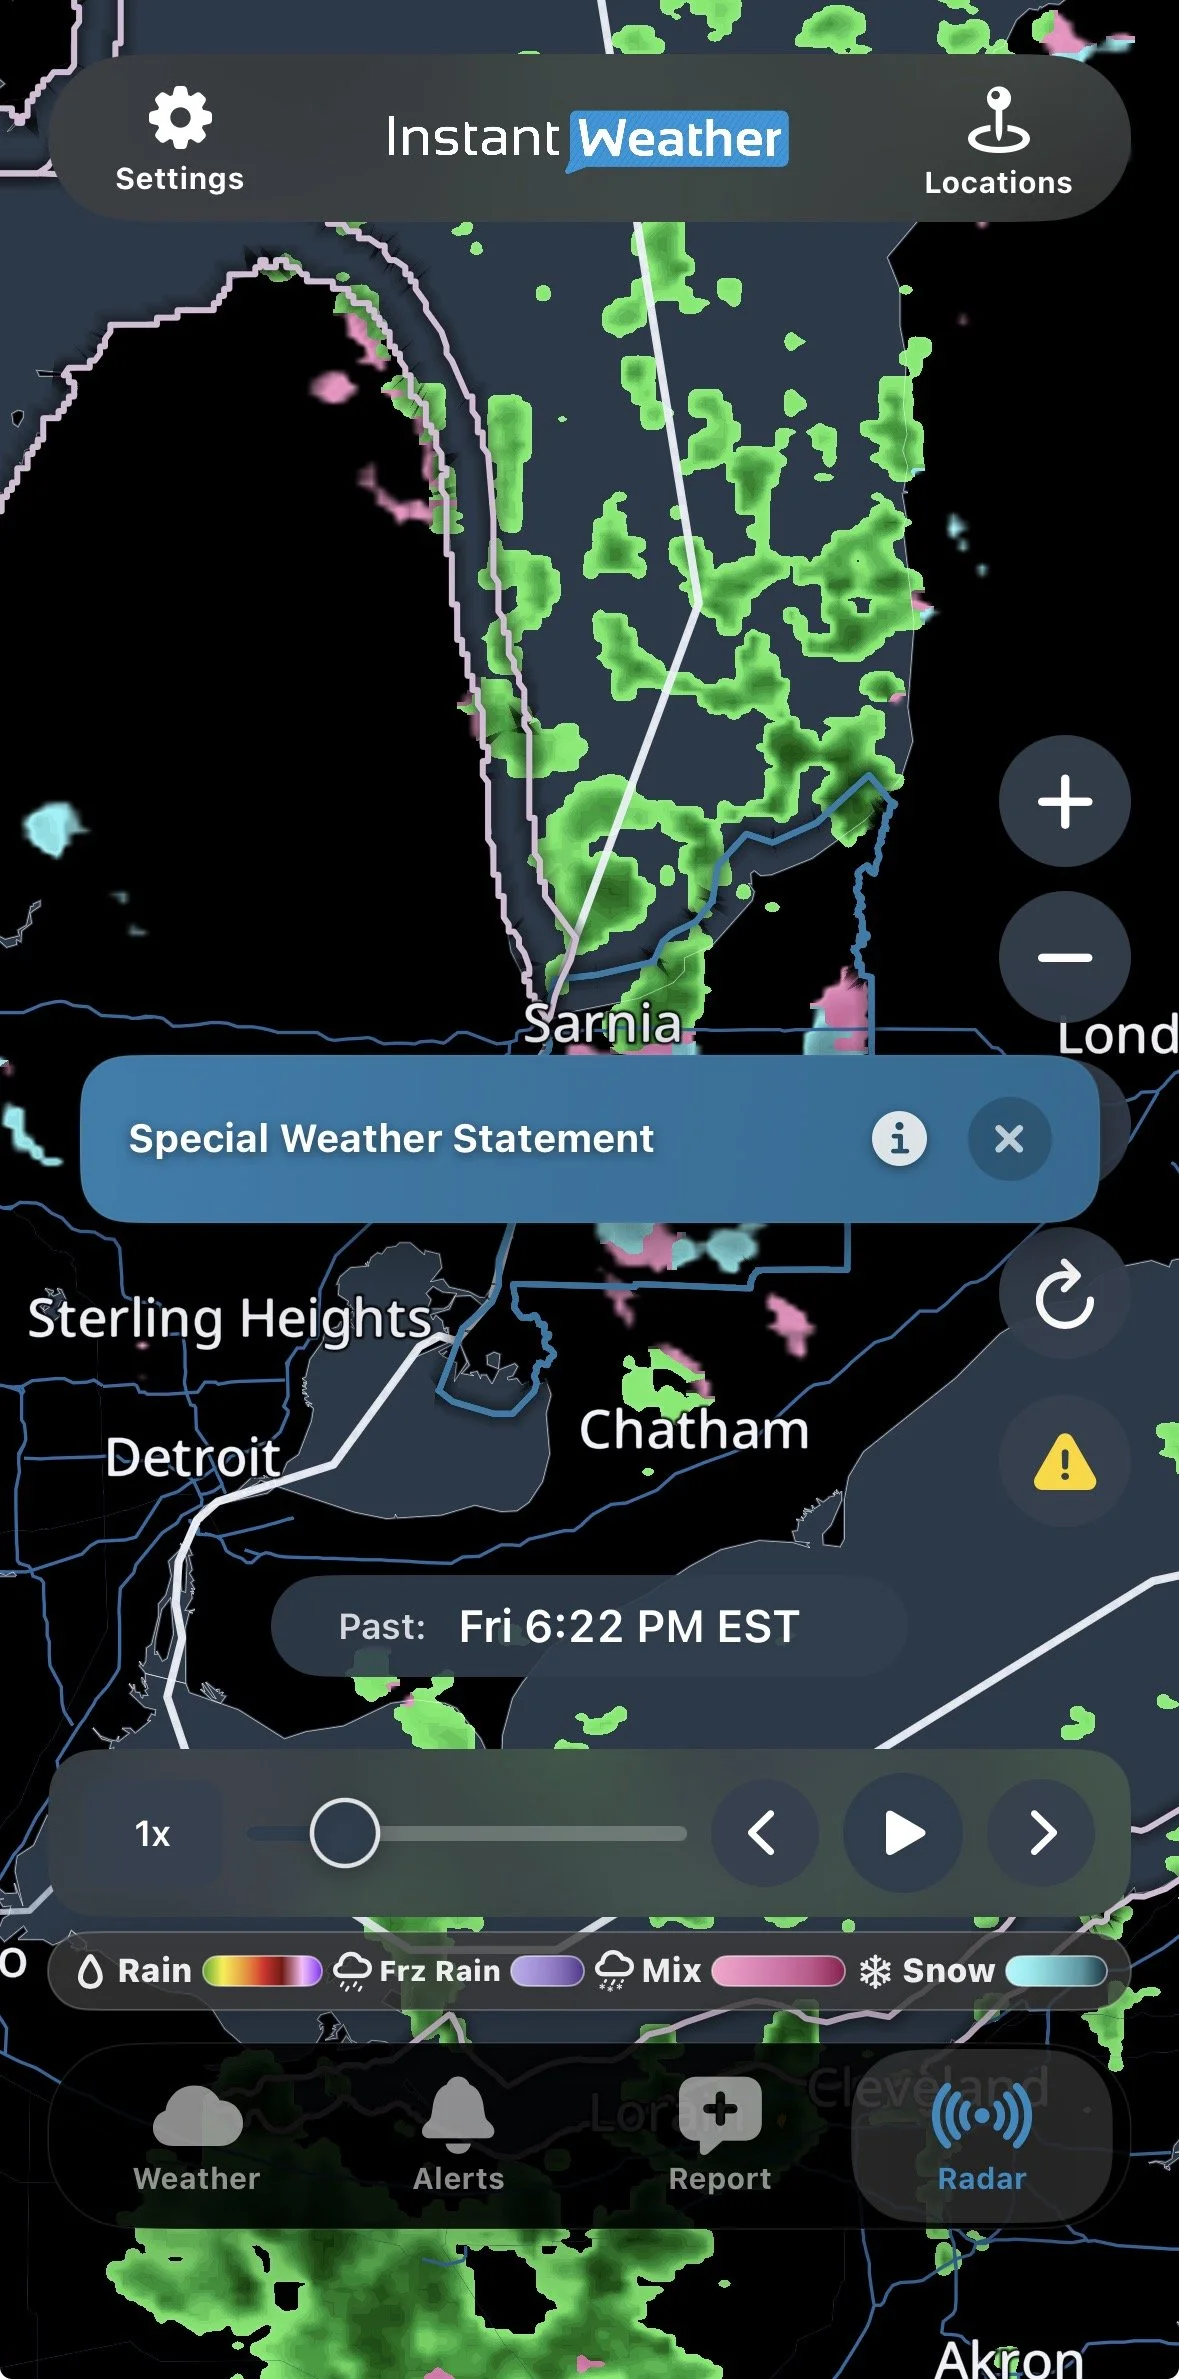
  2. Tap an outlined area on the radar map.

  3. A coloured banner appears showing the applicable alert or Instant Update.

  4. Tap the information (i) button on the banner.

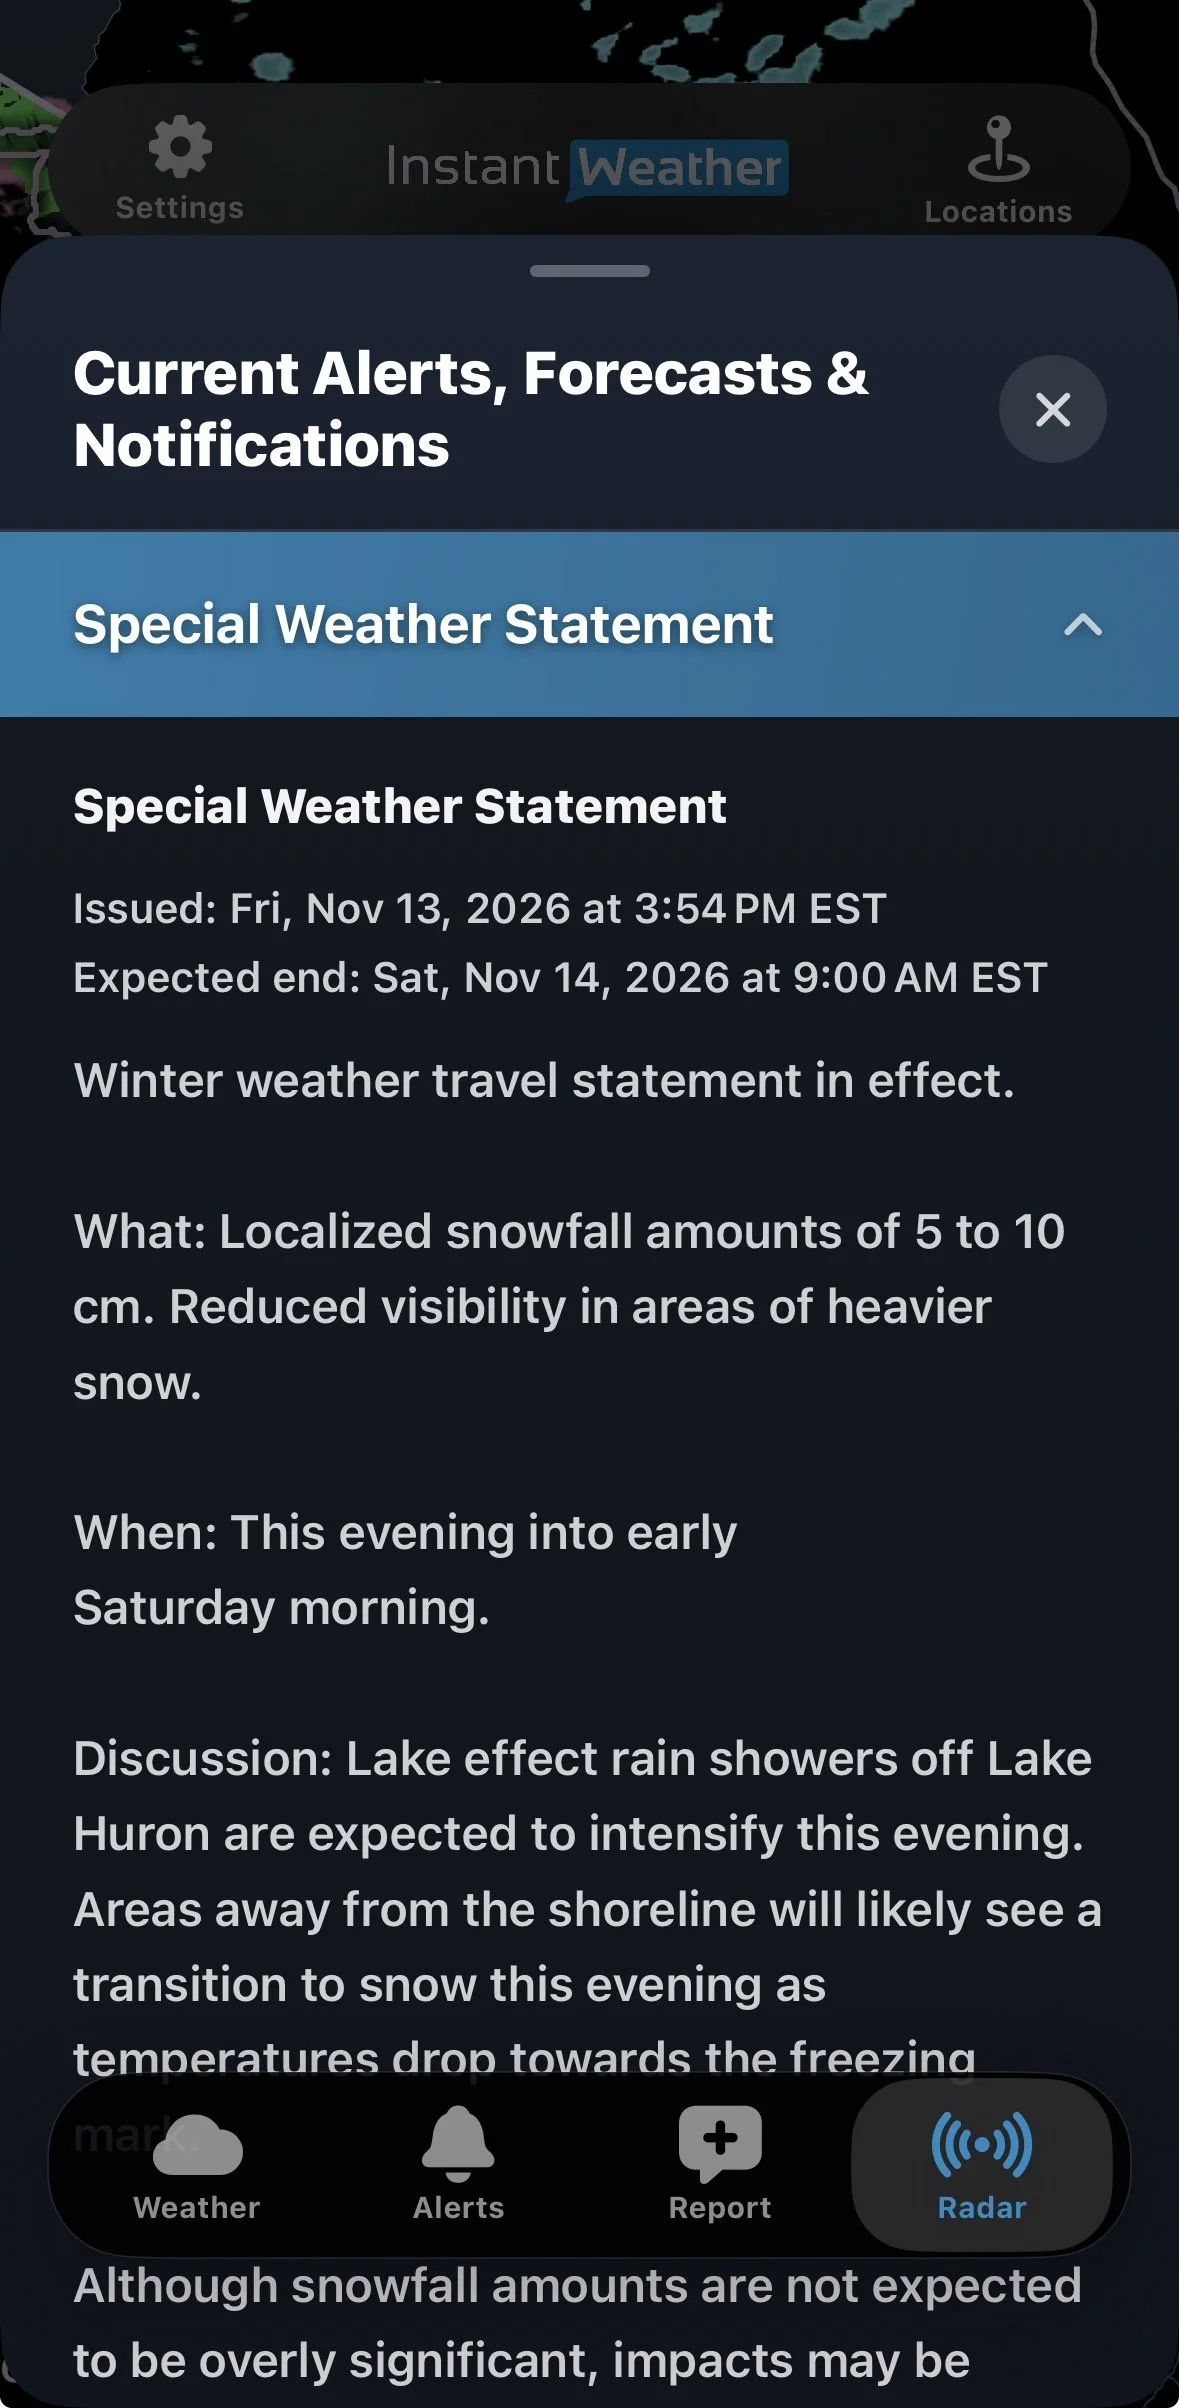
  5. The Current Alerts, Forecasts & Notifications panel opens.

  6. Tap a heading to expand or collapse its details.

  7. Tap X to close the panel.

If more than one alert or update applies to the selected area, you can review them individually.

Selecting a Weather Alert on the Radar

Viewing Weather Alert Details

Instant Weather Forecasts and Official Weather Alerts

In addition to official government weather alerts, Instant Weather provides its own forecasts and weather updates.

Instant Weather forecasts may appear in the alert banner on the Weather page and in the Alerts section.

On the radar map, Instant Weather forecasts do not have their own outlined areas.

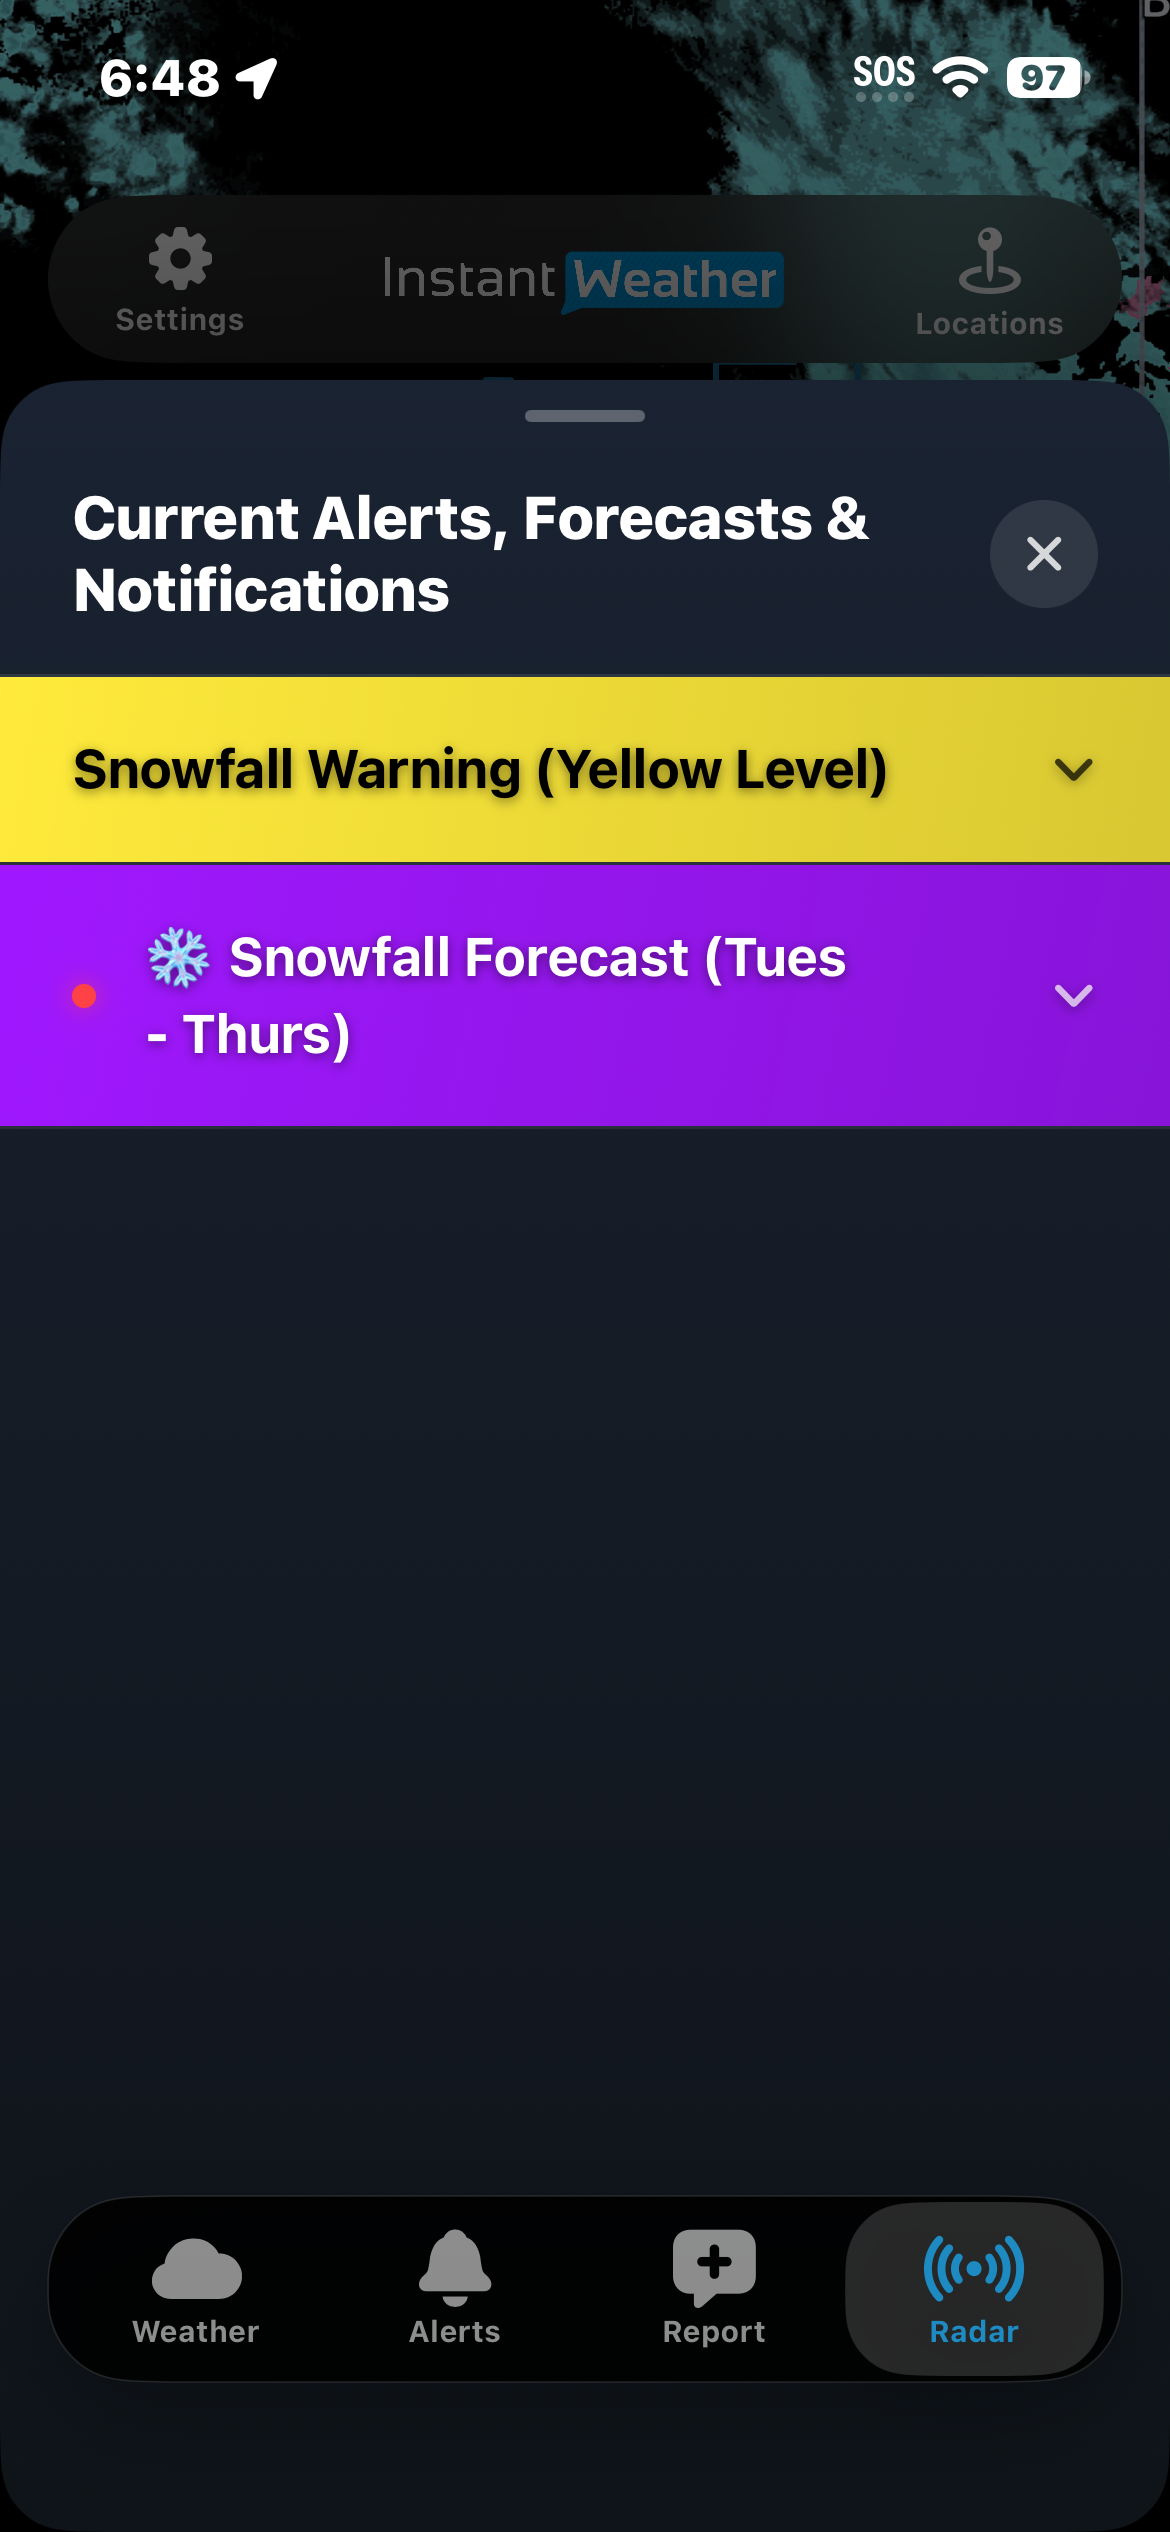
However, when you tap an area affected by an official government weather alert and then tap the (i) button, the Current Alerts, Forecasts & Notifications panel may also display applicable Instant Weather forecasts.

For example, the panel may contain both an Environment Canada Snowfall Warning and an Instant Weather Snowfall Forecast.

Tap either heading to expand or collapse its details.

Important: If an area has an Instant Weather forecast but no official government weather alert, tapping that area on the radar map will not display the forecast. You can still find applicable forecasts through the Weather page or Alerts section.

Official Weather Alert and Instant Weather Forecast

How Subscriptions Affect Radar

The amount of past and future radar available in Mosaic and Smooth Mosaic depends on your subscription.

Free: Past radar: 30 minutes, Future radar: 1.5 hours

Upgrade: Past radar: 30 minutes, Future radar: 12 hours

Extended: Past radar: 2 hours, Future radar: 48 hours

IW Pro: Past radar: 2 hours, Future radar: 48 hours

Raw Mosaic provides approximately three hours of past radar and one hour of future radar from Environment Canada.

IW Pro also includes a separate advanced radar suite with additional features for more detailed weather analysis.

The exact times available on the timeline may vary depending on radar data availability and updates.

Tips for Using Radar

  • Use Smooth Mosaic if you prefer a more continuous radar animation.

  • Use Raw Mosaic to examine precipitation intensity using Environment Canada's radar imagery.

  • Check whether you are viewing past or future radar before interpreting precipitation movement.

  • Zoom in to examine weather approaching a particular location.

  • Enable weather alert and Instant Update outlines to identify areas affected by significant weather.

  • Tap an outlined area and then the (i) button to review additional information.

  • Refresh the radar to check for updated information.

Radar is one tool for monitoring weather conditions. During severe weather, always review official weather alerts and other available weather information.

Need Help?

If the radar is not loading or displaying as expected, try the following:

  1. Update the app: Make sure you're using the latest version of Instant Weather from the Apple App Store or Google Play Store.

  2. Refresh the radar: Tap the Refresh button to reload the radar data.

  3. Restart the app: Close Instant Weather completely and reopen it.

  4. Reinstall the app: If the problem continues, try deleting the app and reinstalling it from the Apple App Store or Google Play Store.

Note: Reinstalling may reset some app settings or locally stored information.

If you're still experiencing problems, please contact Instant Weather Support at help@InstantWeather.ca.

Include your device type, app version, selected radar type and a description of the issue. Screenshots are also helpful.

Last updated: November 13, 2026

Back to Instant Weather Help Centre

What does the red LIVE badge mean?

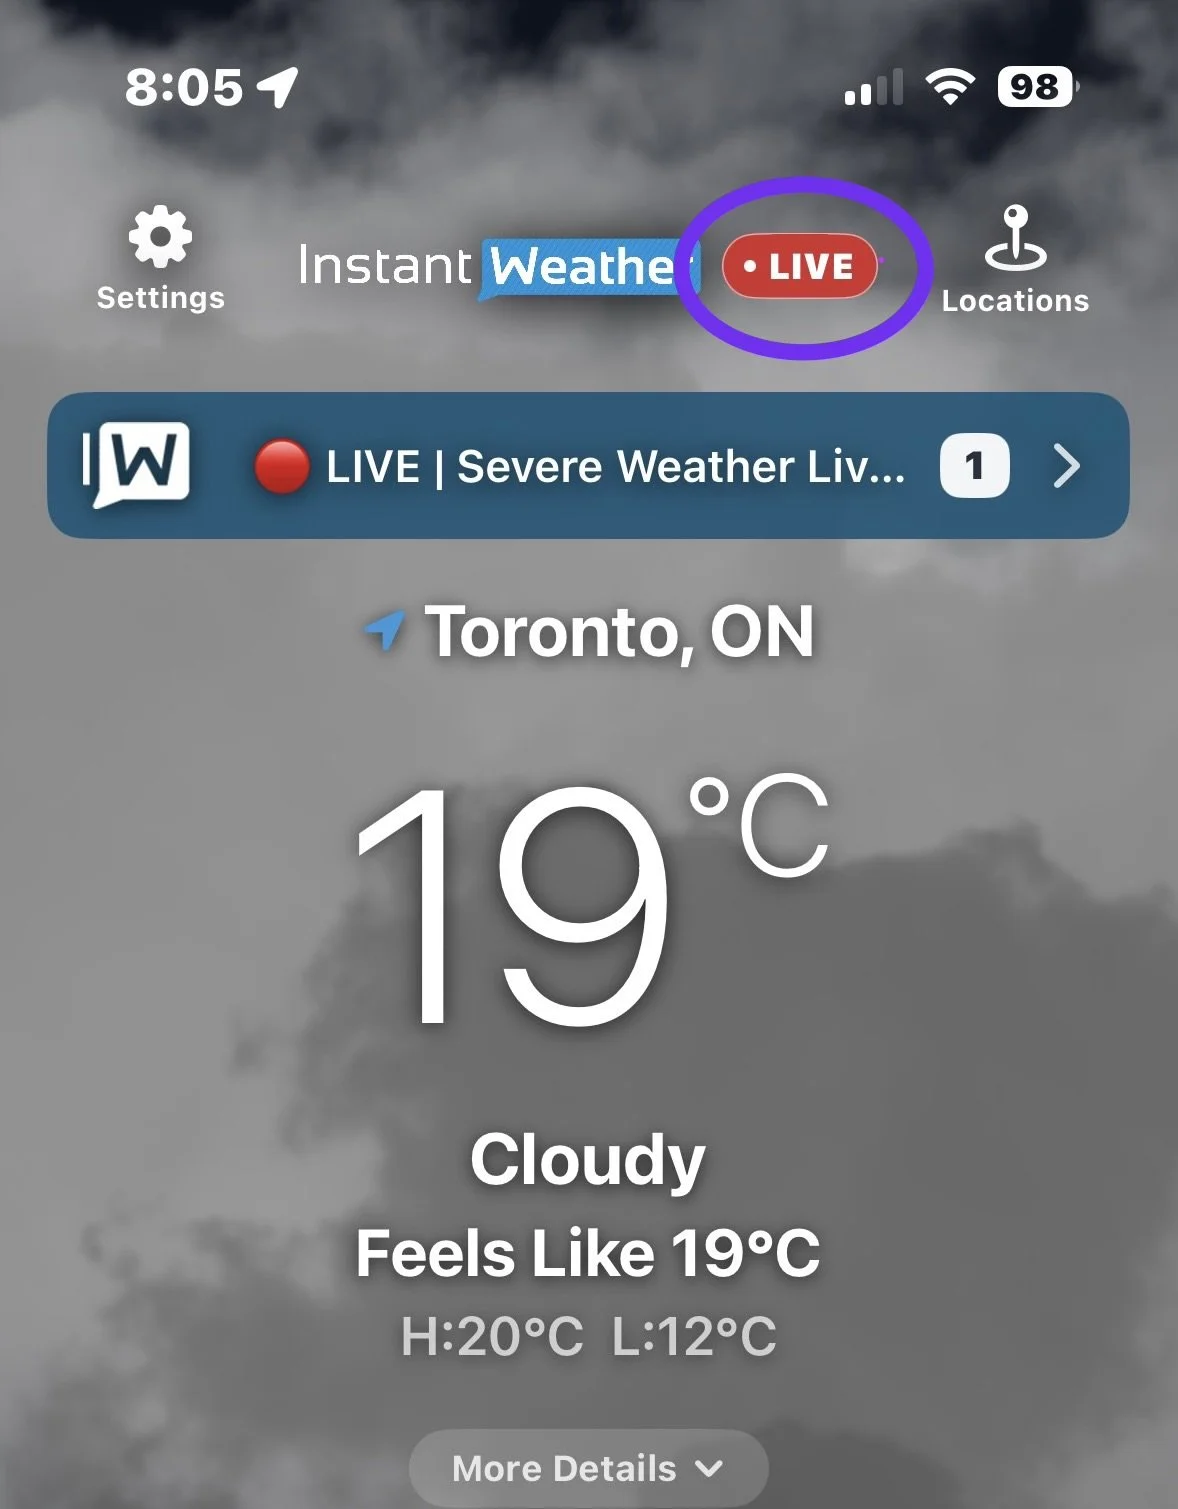
When you see the red LIVE badge beside the Instant Weather logo at the top of the app, it means our team is currently livestreaming.

Live Badge in the App

Watching our livestreams in the app is free. No paid Instant Weather subscription is required.

How to watch the livestream

  1. Tap the red LIVE badge to open the livestream in a floating video window.

  2. Tap the Play button in the centre of the video to start watching.

The floating window lets you watch our coverage while checking the forecast or radar within the app.

Video window controls

At the top of the video window, you’ll find:

  • Move: Reposition the video window.

  • YouTube: Open the livestream on YouTube.

  • Settings: Access the video window settings.

  • X: Close the video window.

If you close the window, you can tap the red LIVE badge to open it again while we’re live.

Can I watch on another device or my TV?

Yes! The red LIVE badge lets you know we’re broadcasting. You can watch within the Instant Weather app or open YouTube on another phone, tablet, computer or smart TV.

Visit our Instant Weather YouTube channel to find the livestream. On a TV, search YouTube for @InstantWeather.

Last updated: November 10, 2026

Back to Instant Weather Help Centre

Using Report Weather in the Instant Weather App

The Report Weather feature in the Instant Weather app allows you to tell us what is actually happening in your area.

Your reports can be especially valuable during severe weather. Radar can show us what is happening within a storm, but it cannot always tell us exactly what is occurring at the ground. For example, radar may indicate rotation in a thunderstorm, but reports from people in the area can help confirm whether a tornado, damaging winds, hail, or other severe weather is actually occurring.

Reports of everyday weather are valuable too. If the current conditions shown in the app don't match what you're experiencing, submitting a report provides us with useful information that can help us improve the weather information we provide.

Report Weather isn't limited to current weather conditions. You can also report storm damage, power outages, flooding, road closures, and other weather-related hazards, as well as noteworthy conditions and events such as poor air quality, northern lights, and impressive sunrises or sunsets.

You can submit a quick report or include a photo or video captured directly through the app.

Report Weather is available with both the Original and Updated Weather Page styles. The appearance of the reporting screen may vary depending on the style and display settings you are using.

Opening Report Weather

How you open Report Weather depends on the Weather Page style you are using:

  • Updated Weather Page: Select Report from the navigation bar at the bottom of the app.

  • Original Weather Page: Select Report Weather from the bar that also contains Minutes, Hours, and the other weather options.

Once you open Report Weather, the reporting options are essentially the same with either Weather Page style.

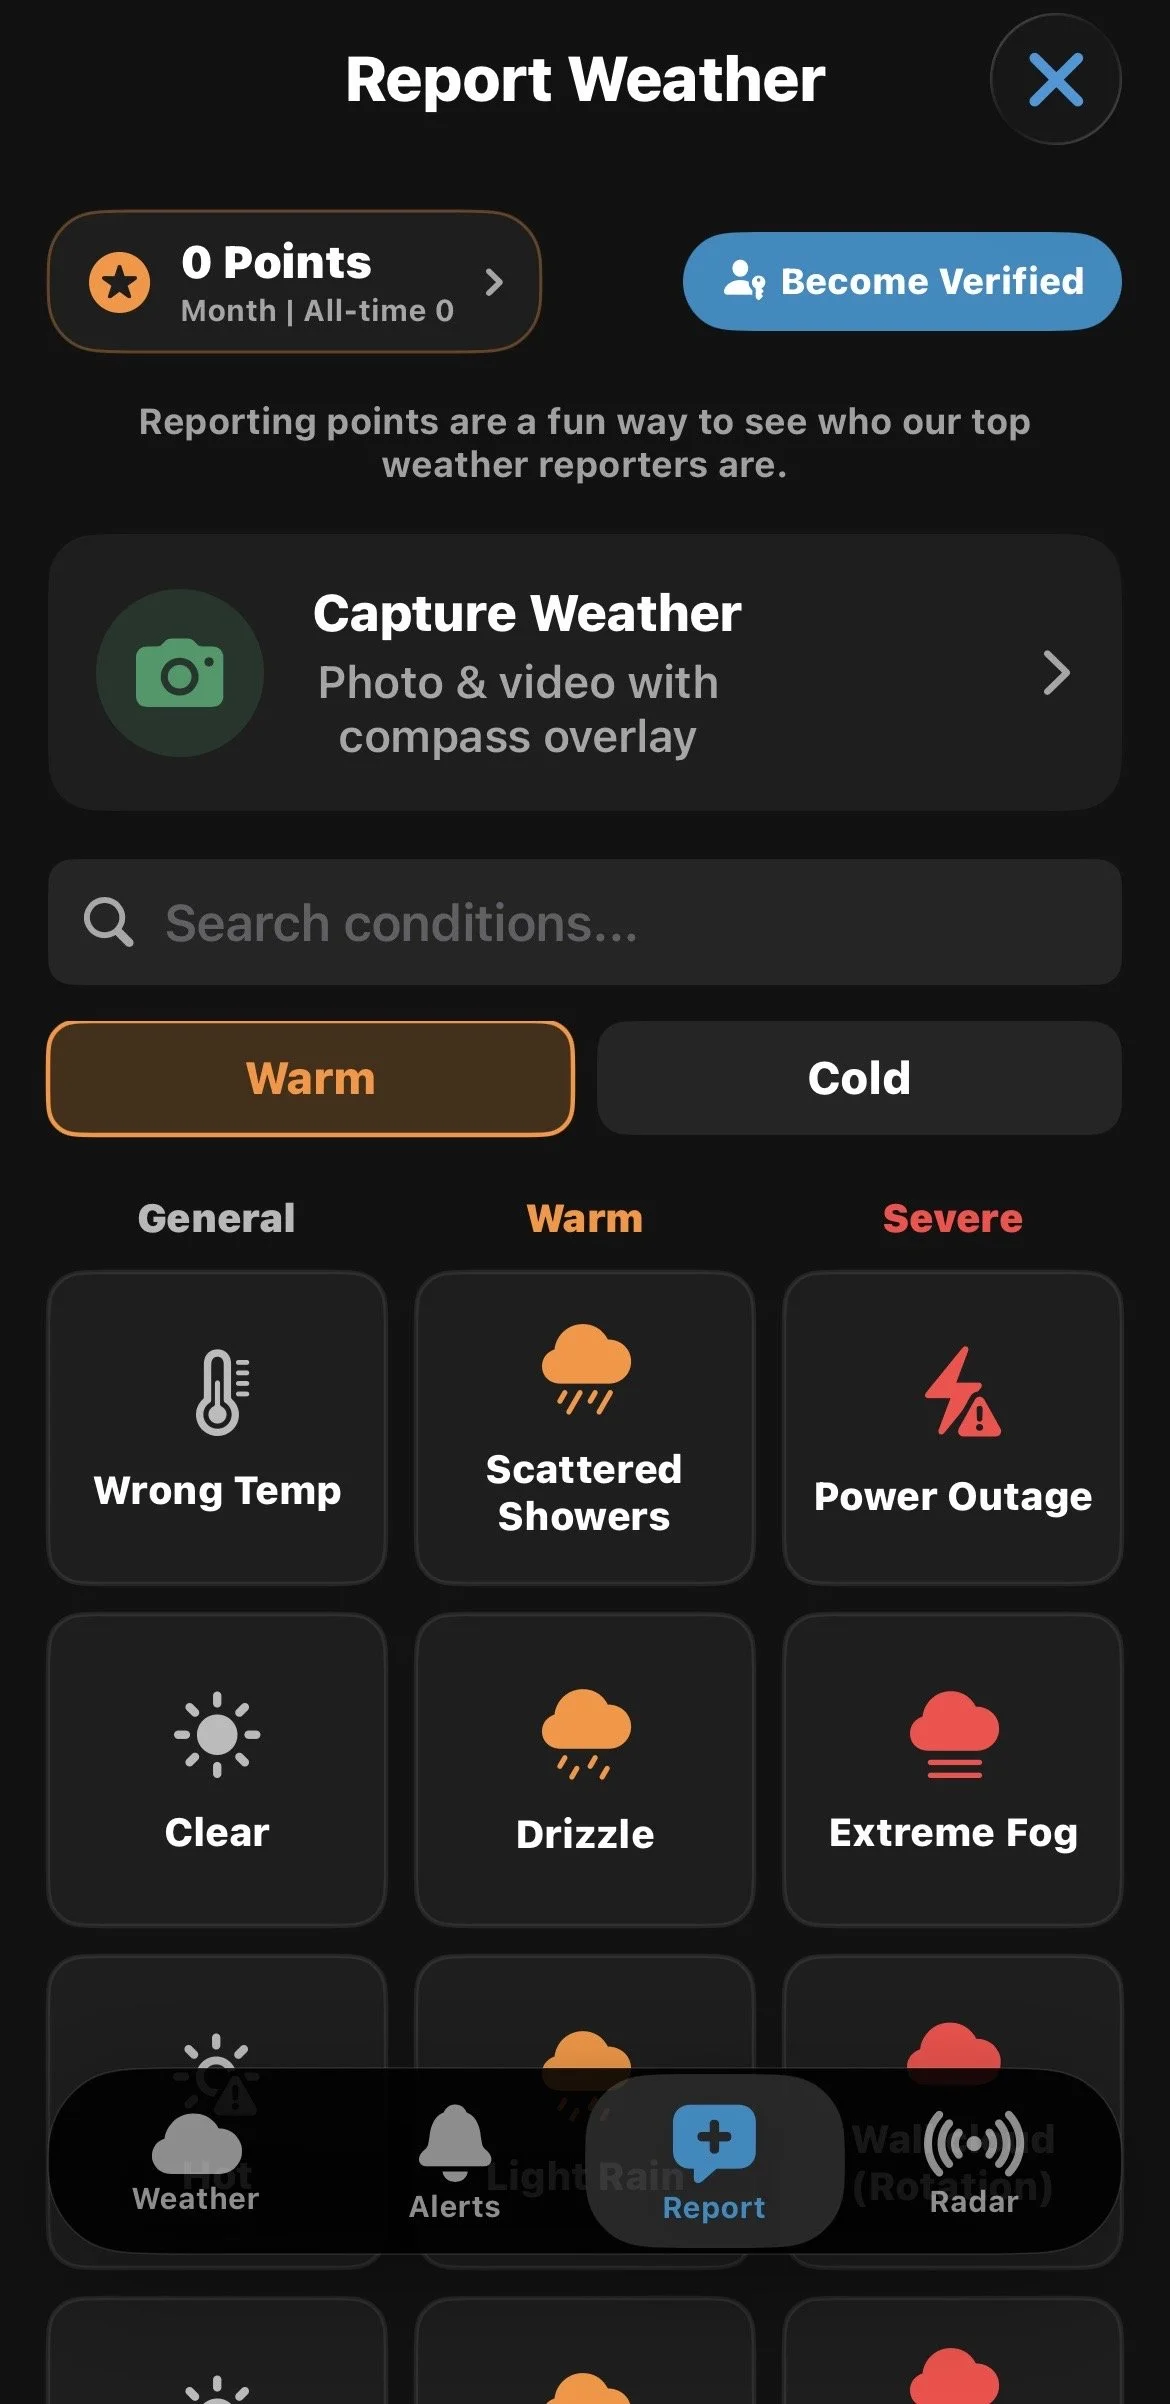
The Report Weather screen showing reporting options, Capture Weather, Search conditions, and reporting points.

Submitting a Report

Reports are organized into Warm Reports and Cold Reports, with conditions grouped into categories such as General, Warm or Cold, and Severe.

Choose the category that best matches the current conditions, then select what you would like to report. There are many report types available, ranging from everyday weather to severe weather, damage, hazards, and other noteworthy conditions.

Use Search conditions to quickly find a specific report type. This can be particularly helpful when reporting a specific hazard, impact, or event.

You don't need to include a photo or video to submit a report.

Please Make Your Reports Accurate

Please submit accurate reports. Reports help us understand what is actually happening in an area, so please report conditions, amounts, damage, and other information as accurately as possible. Inaccurate or intentionally false reports can make it more difficult for us to understand what is really happening.

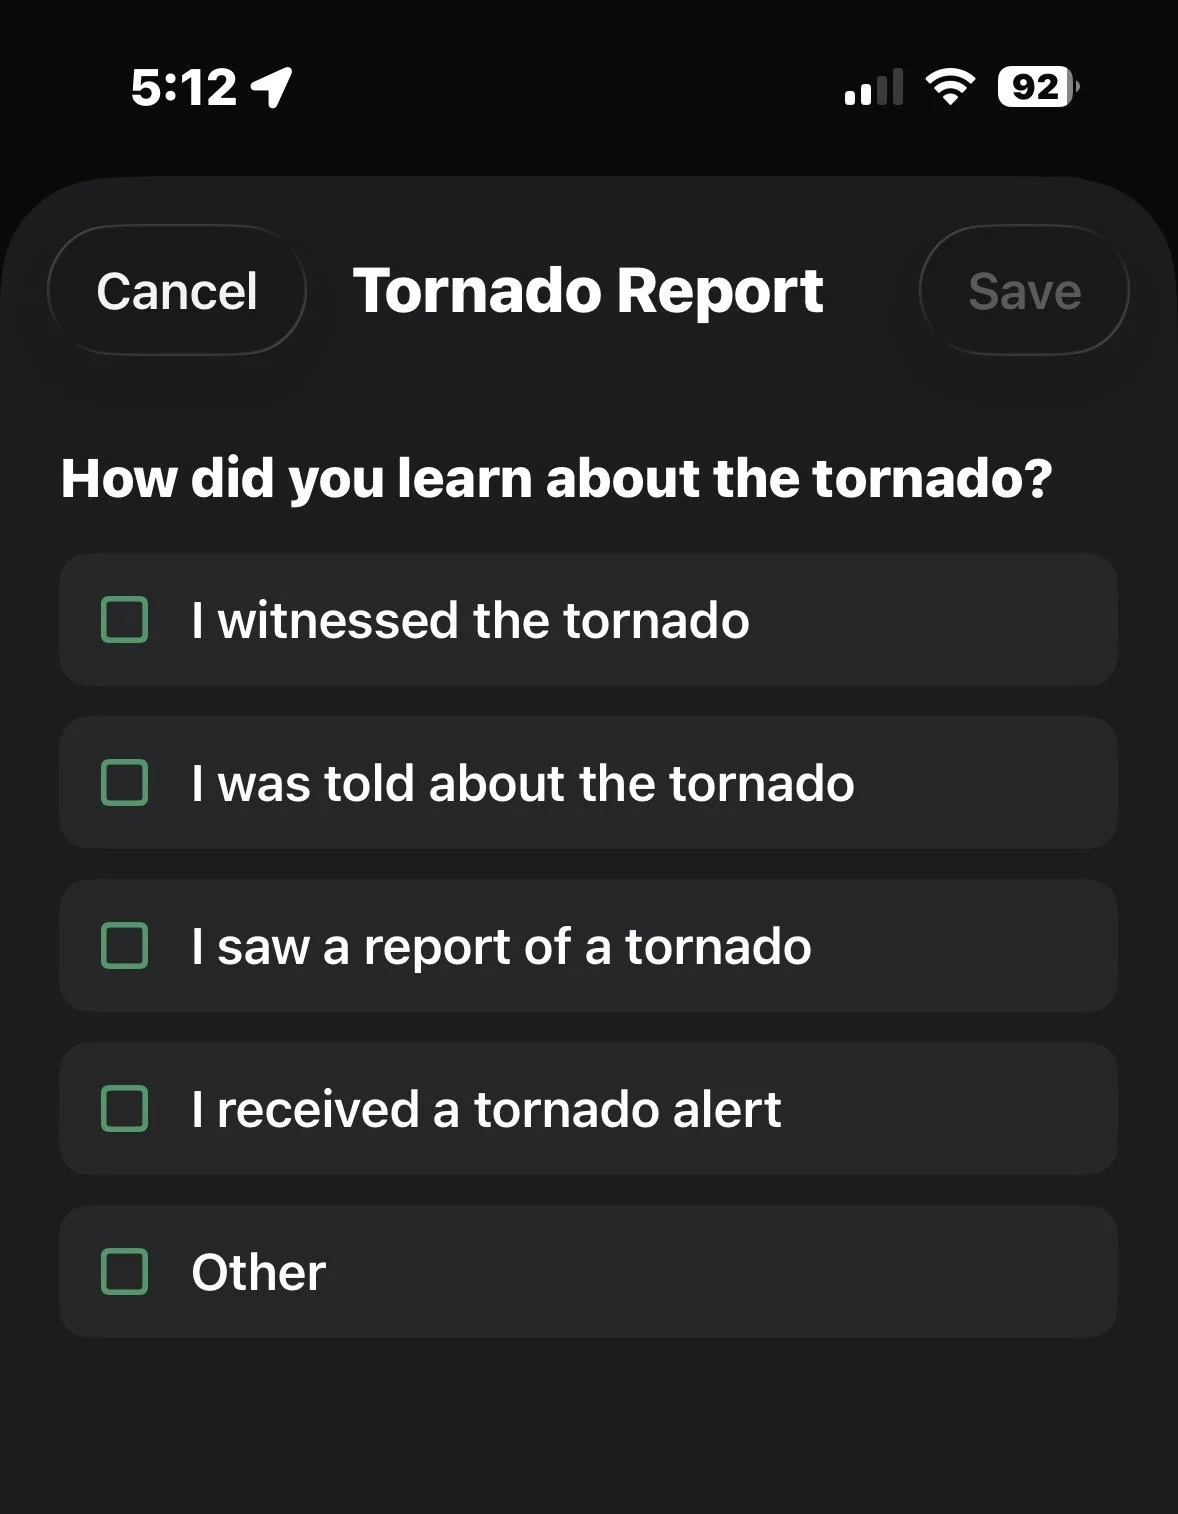
For some significant report types, such as Tornado and Funnel Cloud, the app will ask how you learned about the event. Select the option that best describes the source of your report.

For example, you can indicate whether you witnessed it yourself, were told about it, saw a report, received an alert, or learned about it another way.

When reporting a tornado, the app asks how you learned about the event.

Adding a Photo or Video

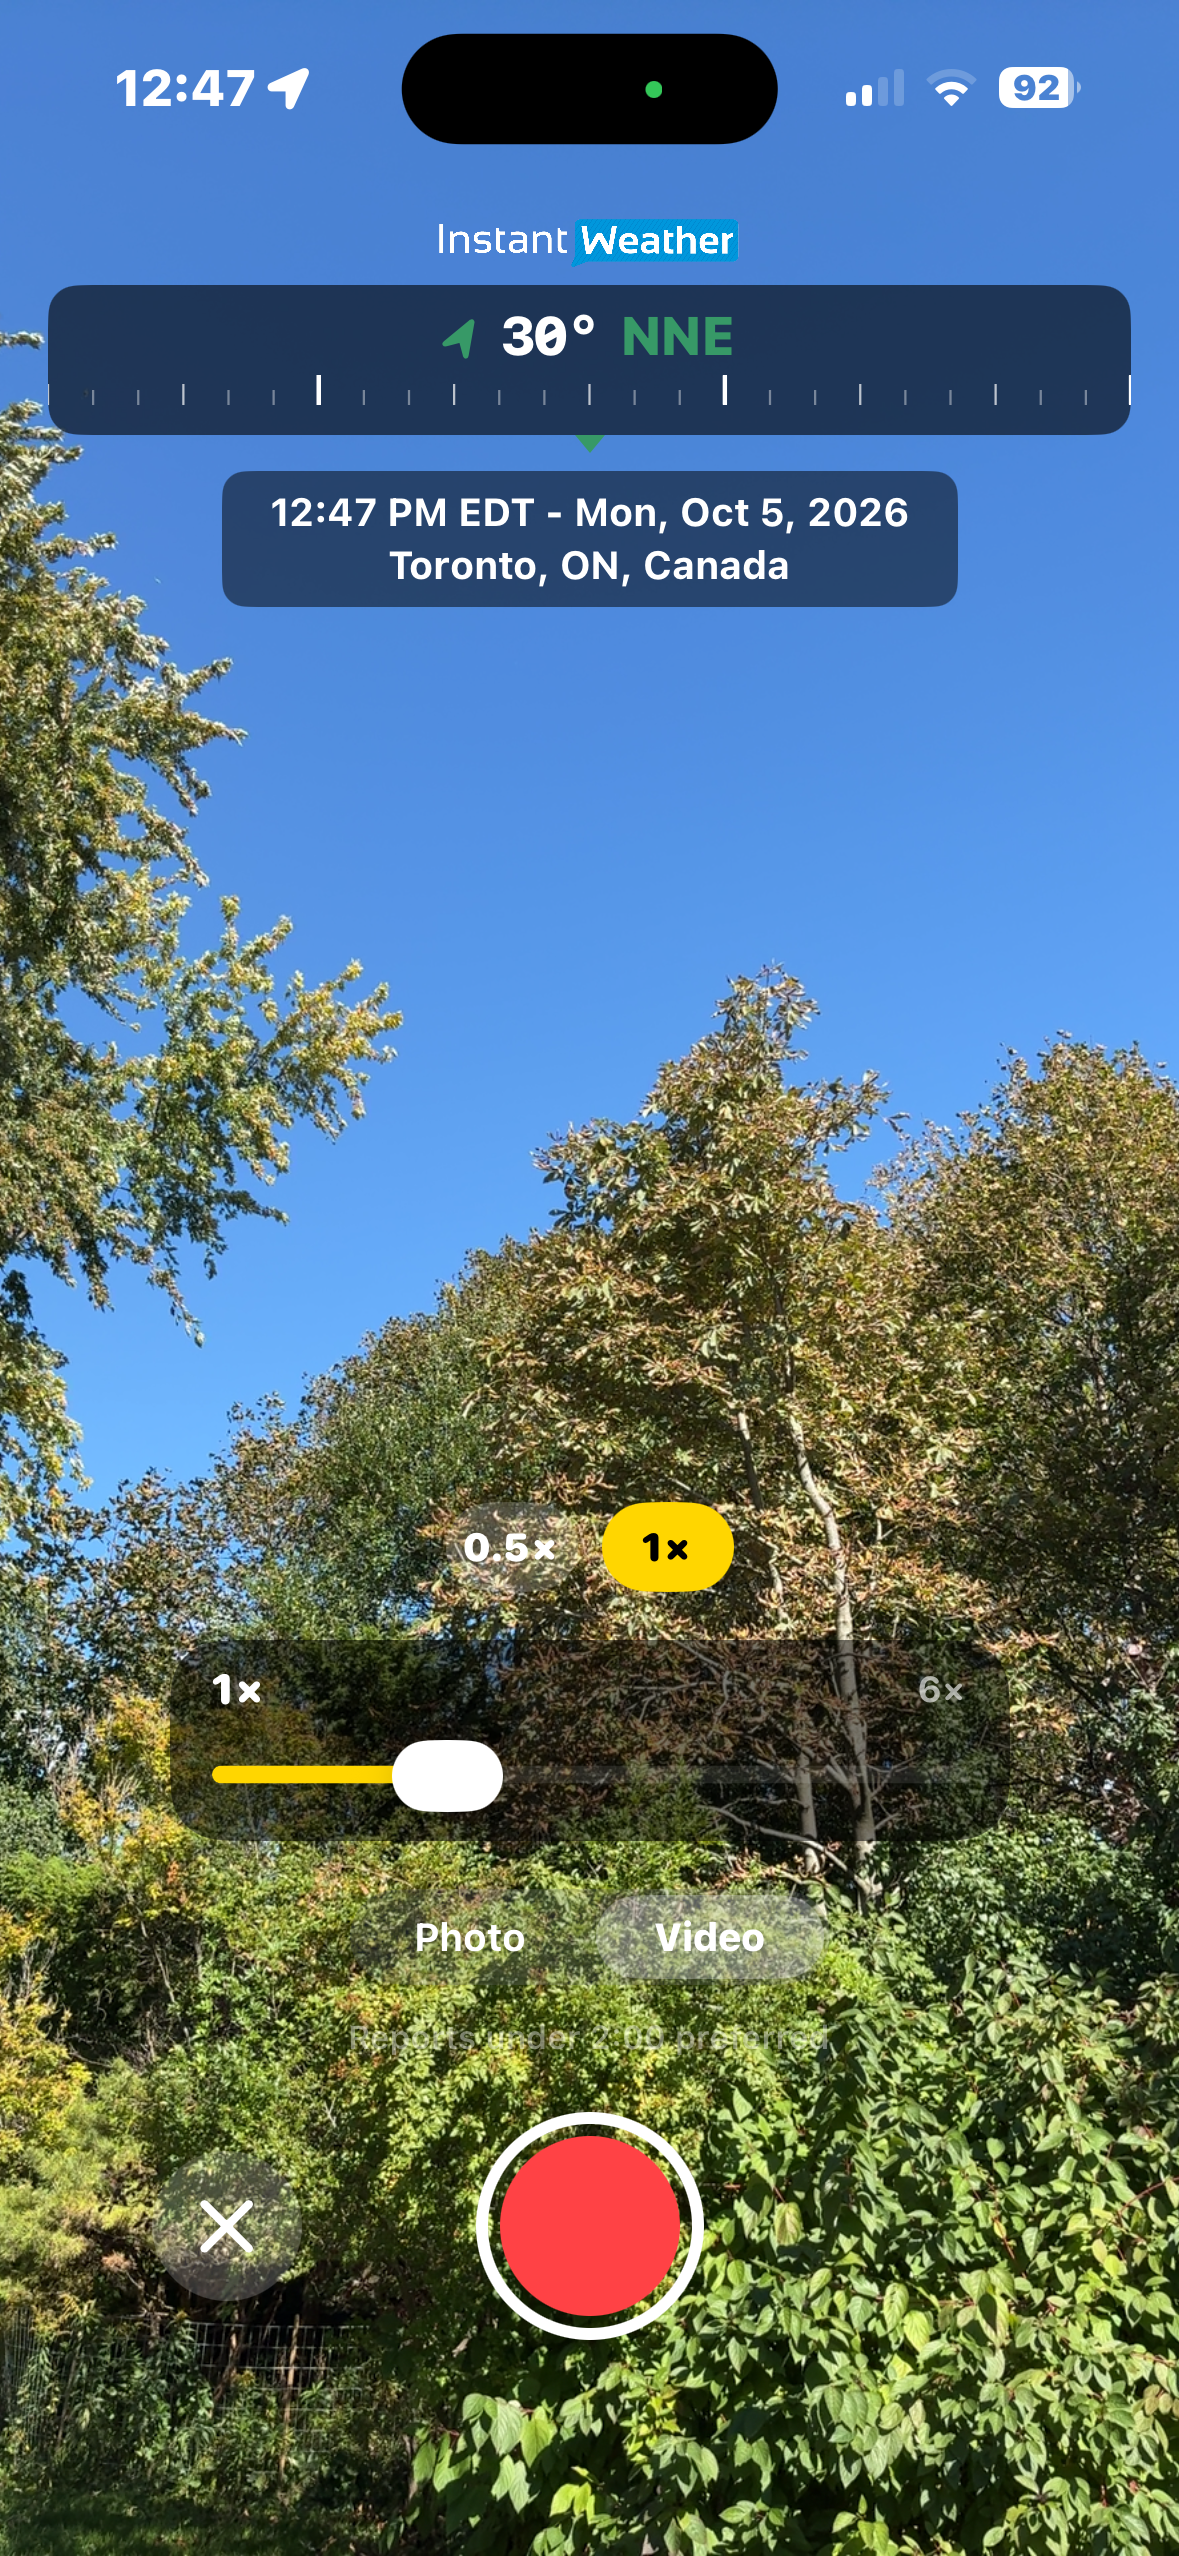
To include a photo or video with your report, select Capture Weather.

Your device may ask you to allow Instant Weather to access your camera and microphone the first time you use this feature.

Choose Photo or Video, then capture what you are observing.

Photos and videos are captured directly through the app rather than selected from your photo library. This helps ensure that reports represent current conditions at the reported location.

Information is added to your photo or video, including the date and time, location, and direction the camera is facing.

The Capture Weather camera includes a compass overlay, date, time, and location information.

Photos and Videos During Severe Weather

Photos and videos can provide valuable additional information, particularly during severe weather.

Damage photos can be especially useful in helping us understand what occurred. Relevant damage reports may also be shared with the Northern Tornadoes Project (NTP) for further investigation.

Photos can also help document flooding, landslides, and other impacts. Reports of power outages can provide additional information about a storm's impacts and potential severity.

Video can be especially helpful when movement is important. For example, a video may help us see rotation in a wall cloud, funnel cloud, or possible tornado.

For hail reports: If it is safe to do so, place a ruler or a common object such as a coin beside the hailstone when taking your photo. This provides a size reference and helps us determine how large the hail is.

Always put your safety first. Only take photos or videos when you can do so safely.

Adding Conditions and Details

After capturing your photo or video:

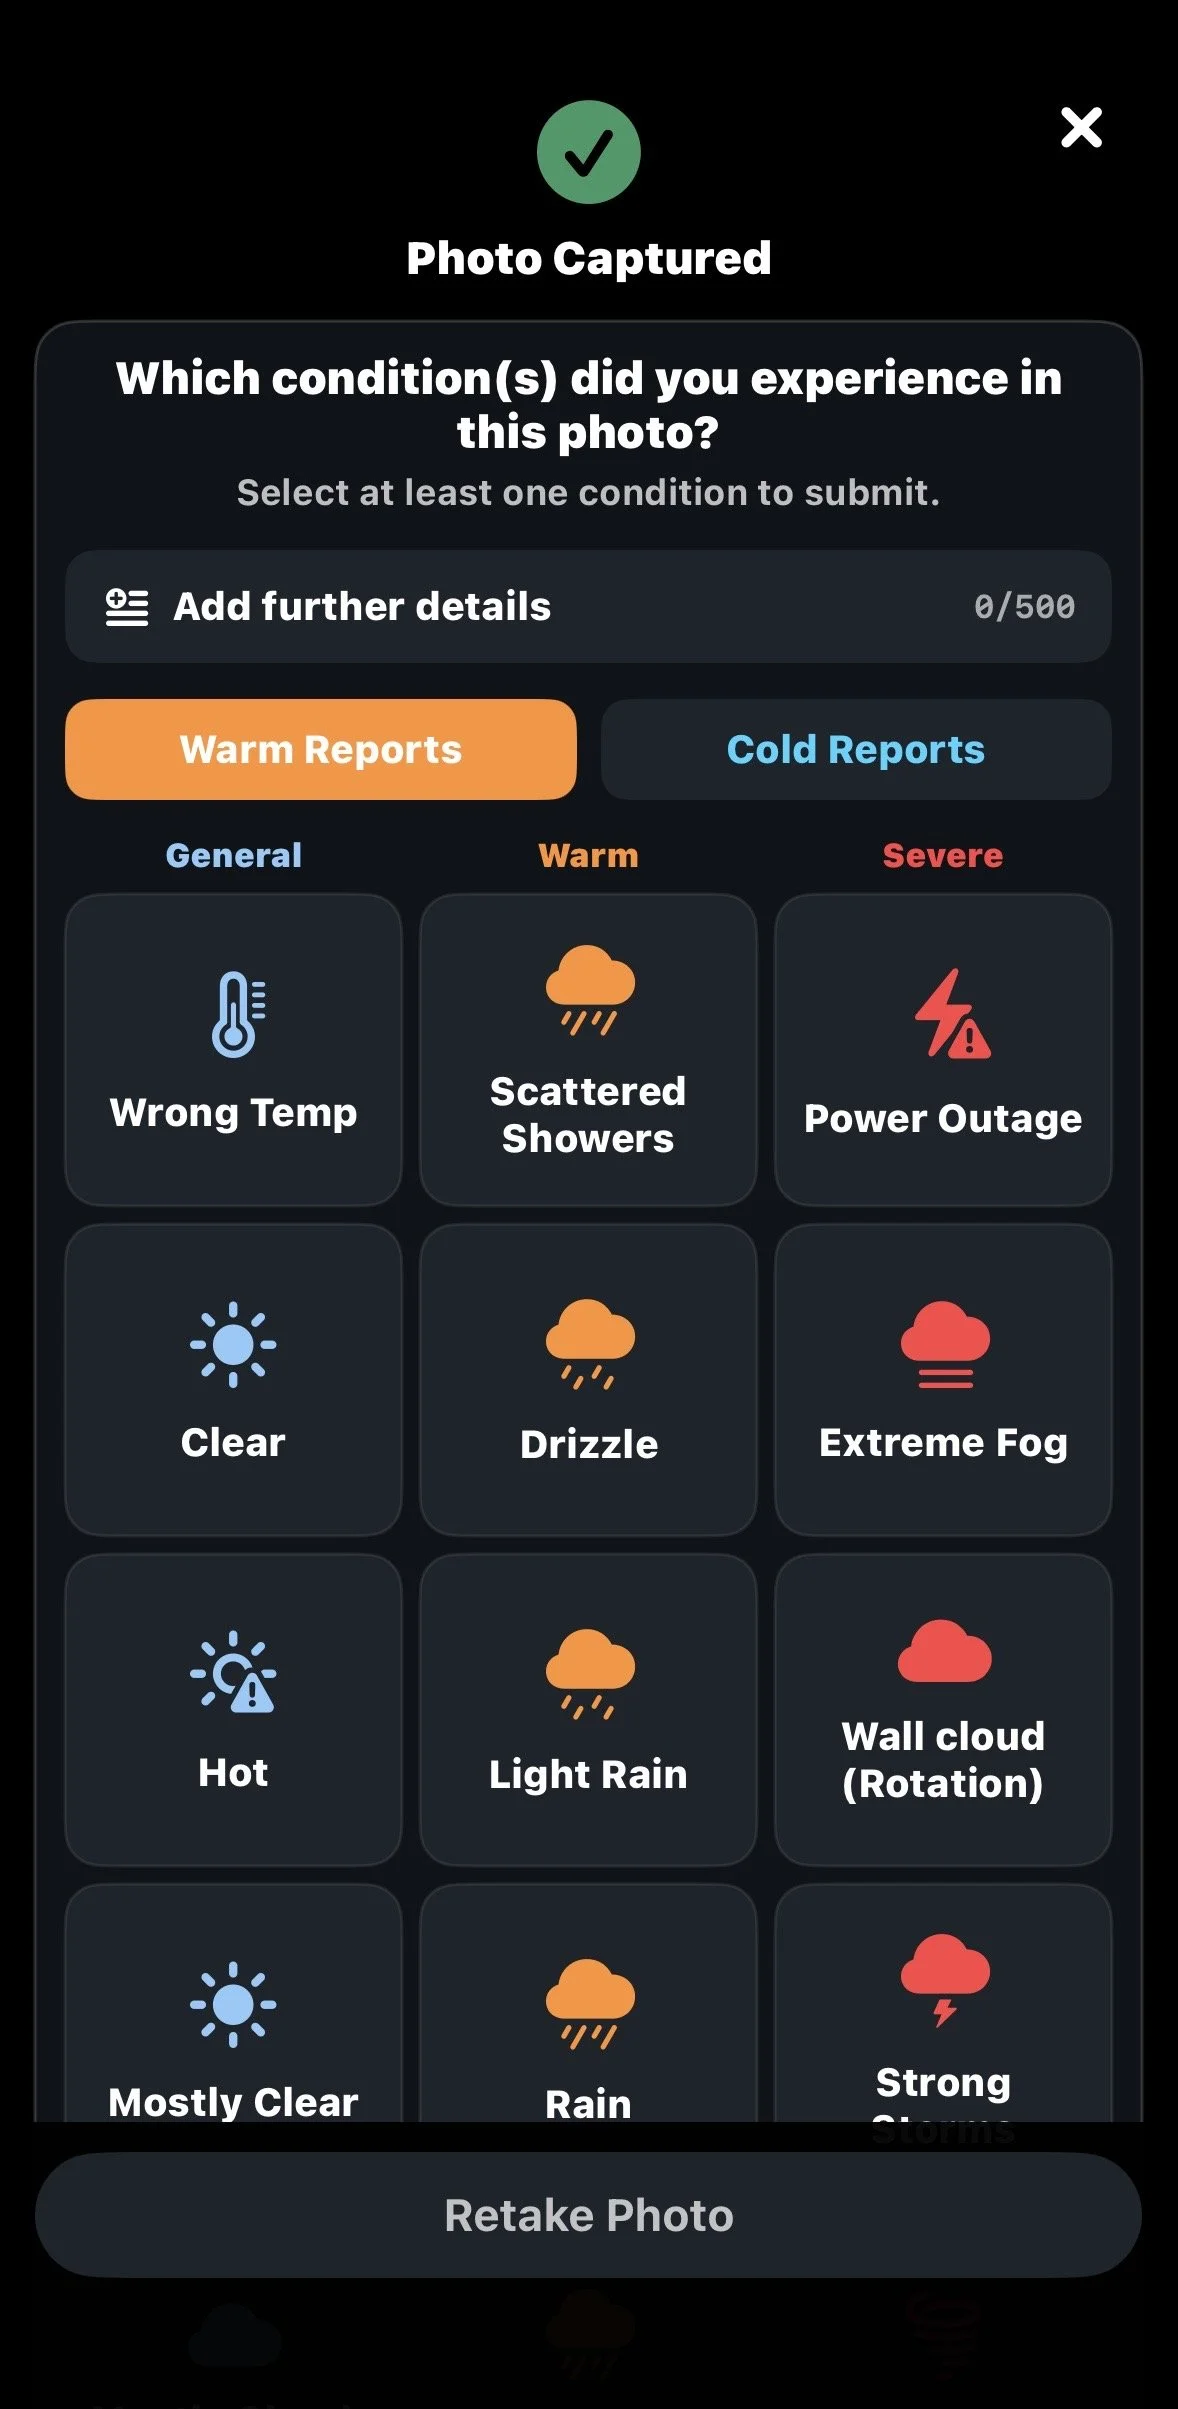
  1. Select at least one condition that describes what you experienced. You can select more than one condition when appropriate.

  2. Select Add further details if you would like to provide additional information about your report.

  3. If you aren't happy with your photo or video, select Retake Photo or Record Again.

  4. When you're ready, select Submit Report.

Providing additional details can be particularly helpful for severe weather, damage, or unusual events.

Tip: Keep videos relatively short and focused on what you are reporting. Shorter videos will generally upload more quickly and are easier to share.

After capturing a photo or video, select the conditions you experienced and add further details if needed.

After You Submit a Photo or Video

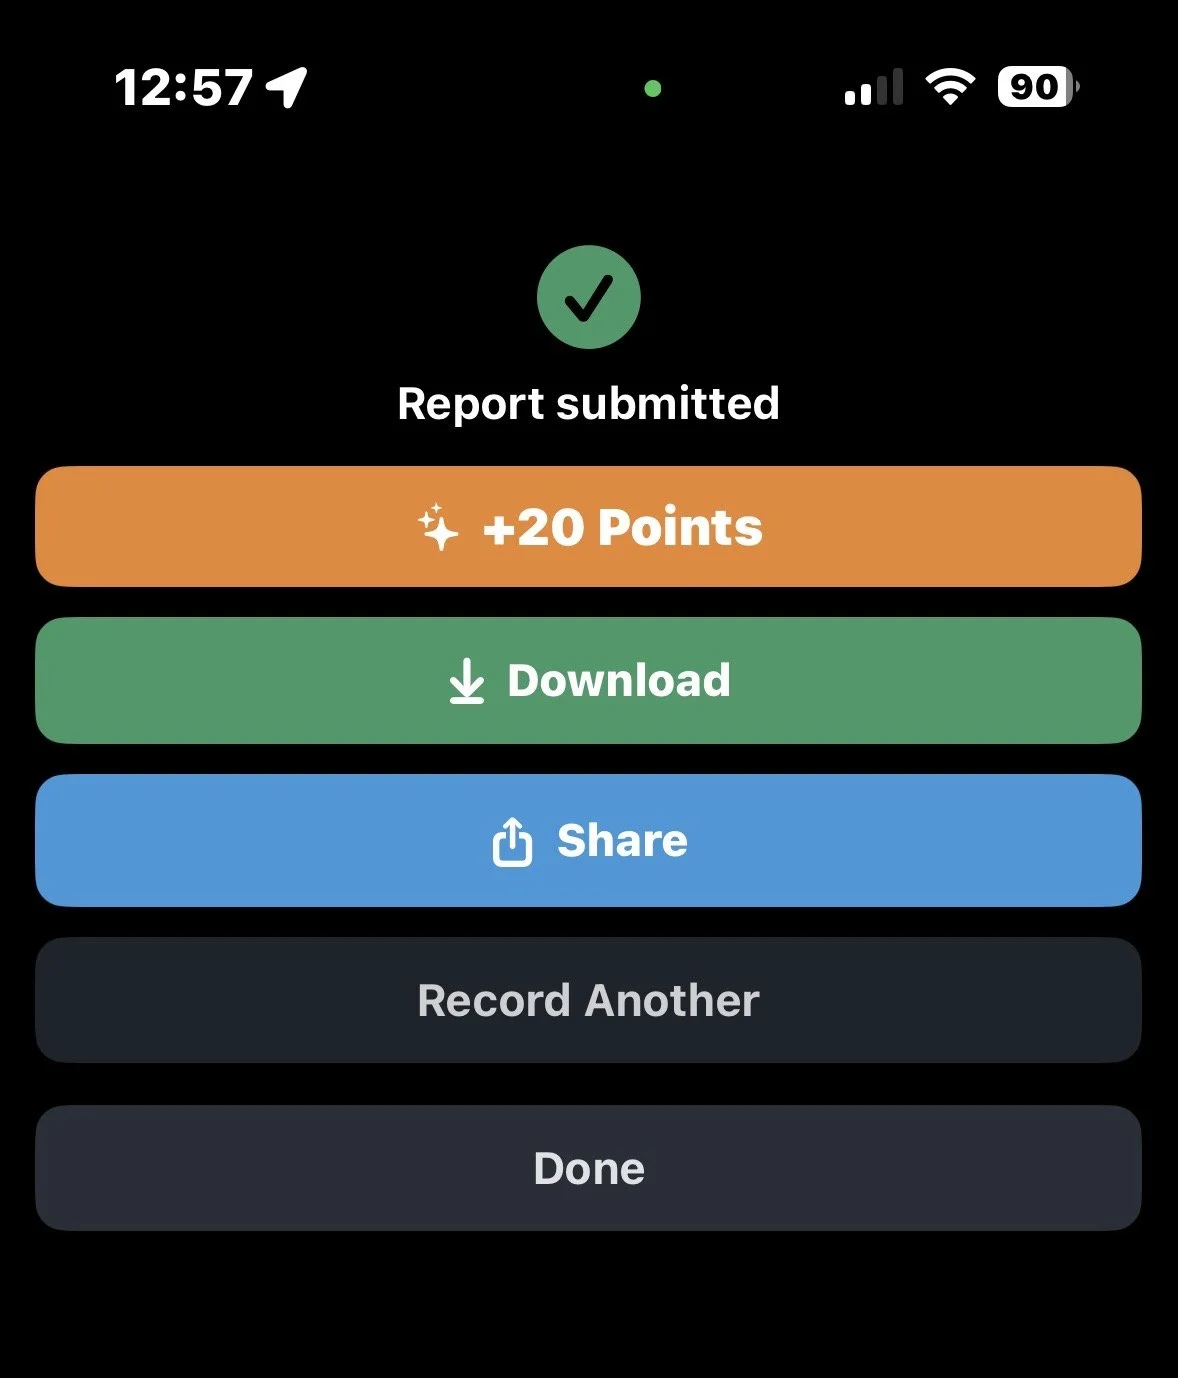
Once your report has been successfully submitted, you'll have several options:

  • Download: Save the photo or video to your device.

  • Share: Share your report using your device's sharing options.

  • Record Another: Capture another report.

  • Done: Finish reporting and return to the app.

After submitting your report, you can download or share your photo or video.

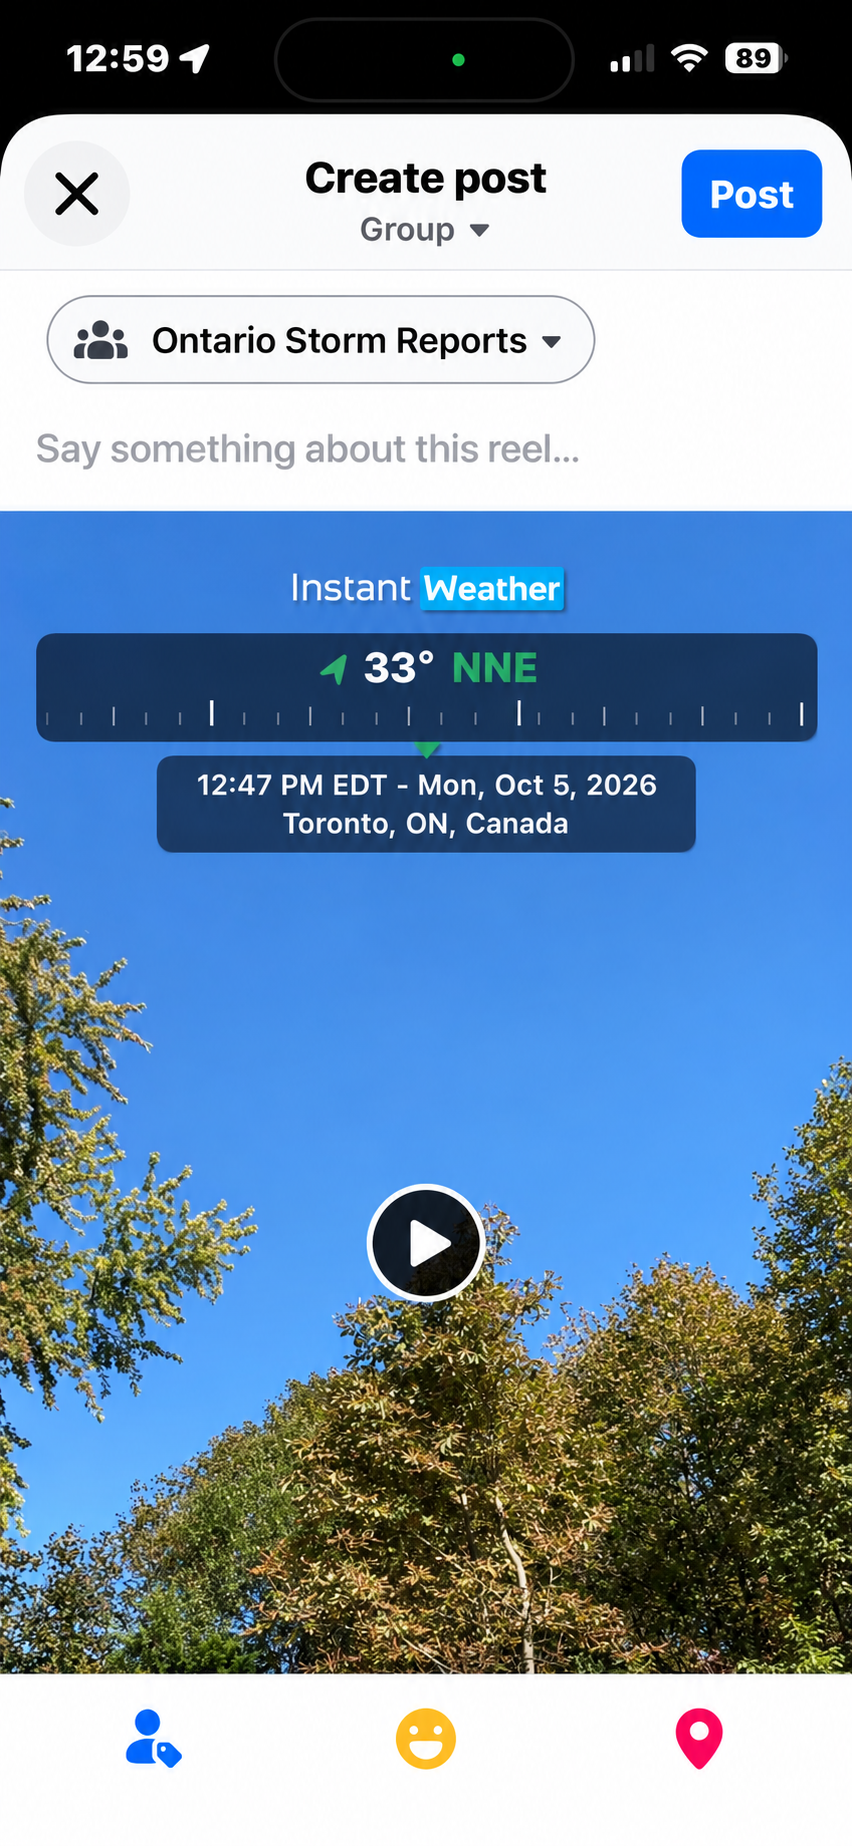
Example of sharing a report with an Instant Weather Storm Reports Facebook group.

Save a Copy of Your Photo or Video

If you would like to keep the photo or video you submitted, download it before leaving the submission screen.

Select Download after submitting your report to save a copy to your device. Your device may ask for permission to save the photo or video the first time you use this option.

We recommend downloading any photos or videos you would like to keep, as submitted media may not be available for you to retrieve later.

Share Your Report

We also encourage you to share significant weather reports with the appropriate Instant Weather Storm Reports Facebook group for your region.

Sharing your report allows other members of the community to see what you experienced. Reports posted to our Facebook groups may also be easier for the Instant Weather team to feature during live severe weather coverage, when viewer reports and photos may be displayed alongside the livestream.

To share your report with a Facebook group:

  1. After submitting your report, select Share.

  2. Choose Facebook from your device's available sharing options.

  3. In Facebook, select Groups.

  4. Choose the appropriate Instant Weather Storm Reports group for your region.

  5. Add any additional information you would like to share, then post your report.

The available sharing options and steps may vary depending on your device and installed apps.

Reporting Points

Submitting reports earns reporting points. Reporting points are a fun way to keep track of your contributions and see how you compare with other weather reporters.

The Report Weather screen displays your points for the current month as well as your all-time total.

The number of points earned may vary depending on the type of report you submit.

Becoming a Verified Reporter

Becoming a Verified Reporter is optional.

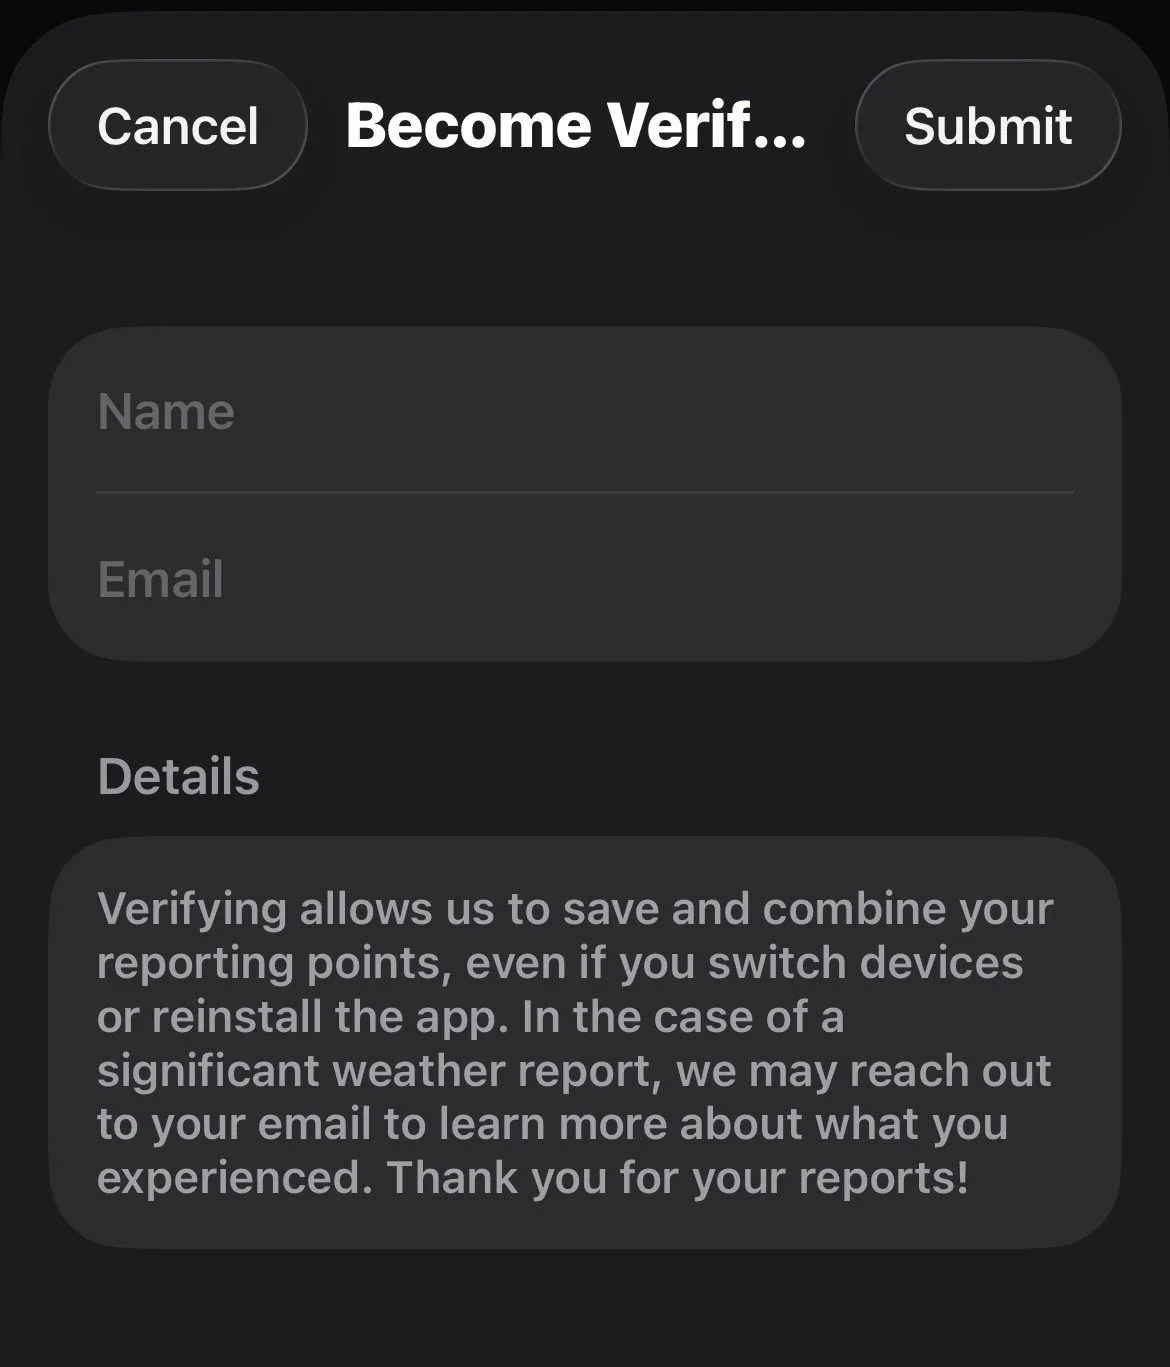
Verification allows Instant Weather to save and combine your reporting points, even if you switch devices or reinstall the app.

It also allows the Instant Weather team to contact you by email if you submit a significant weather report and we would like to learn more about what you experienced.

To become a Verified Reporter:

  1. Select Become Verified from the Report Weather screen.

  2. Enter your name and email address.

  3. Select Submit.

Once verified, the Report Weather screen will show Verified Reporter.

Becoming a Verified Reporter allows your reporting points to be saved and combined across devices.

Last updated: November 10, 2026

Back to Instant Weather Help Centre

Understanding the Weather Pages

The Instant Weather app includes two different Weather Page styles: Updated and Original.

Both styles use the same forecast information, but they organize and display it differently. The Updated style provides a more detailed and interactive view, while the Original style retains the familiar layout from the previous version of the Instant Weather app.

You can try both and choose whichever style you prefer.

Changing the Weather Page Style

To switch between the two styles:

  1. Open the Instant Weather app.

  2. Select Settings.

  3. Scroll to Weather Display.

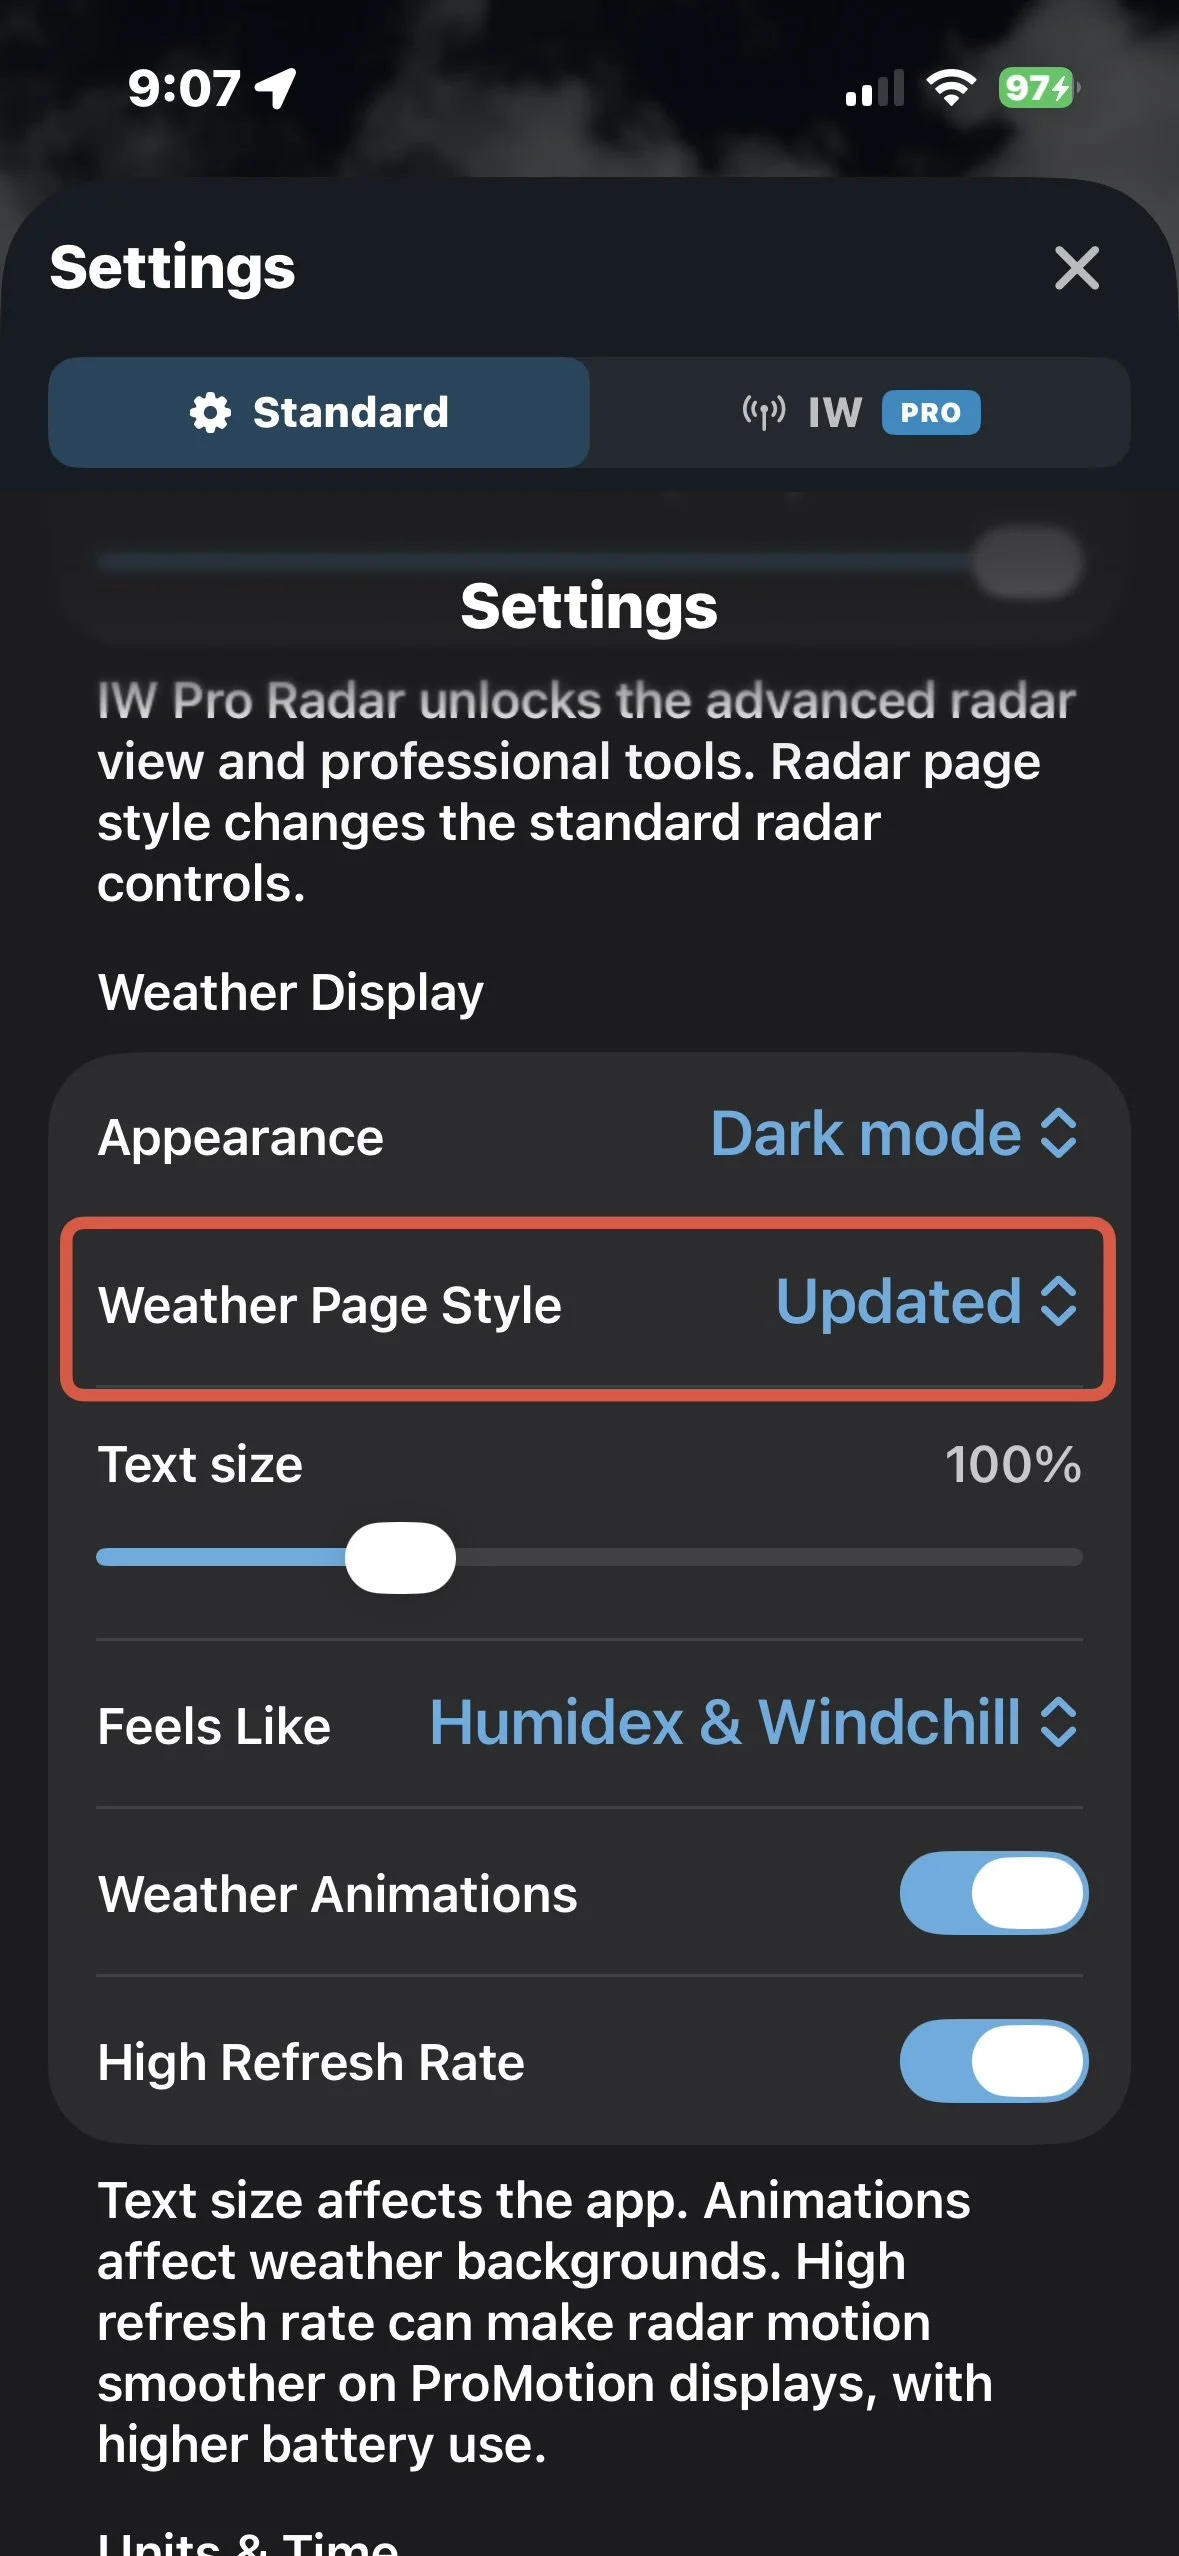
  4. Select Weather Page Style.

  5. Choose Updated or Original.

Your selection can be changed at any time.

Settings showing Weather Page Style

Settings showing Weather Page Style

Current Weather Conditions

One of the biggest differences between the two styles is how current weather information is displayed.

Updated Weather Page

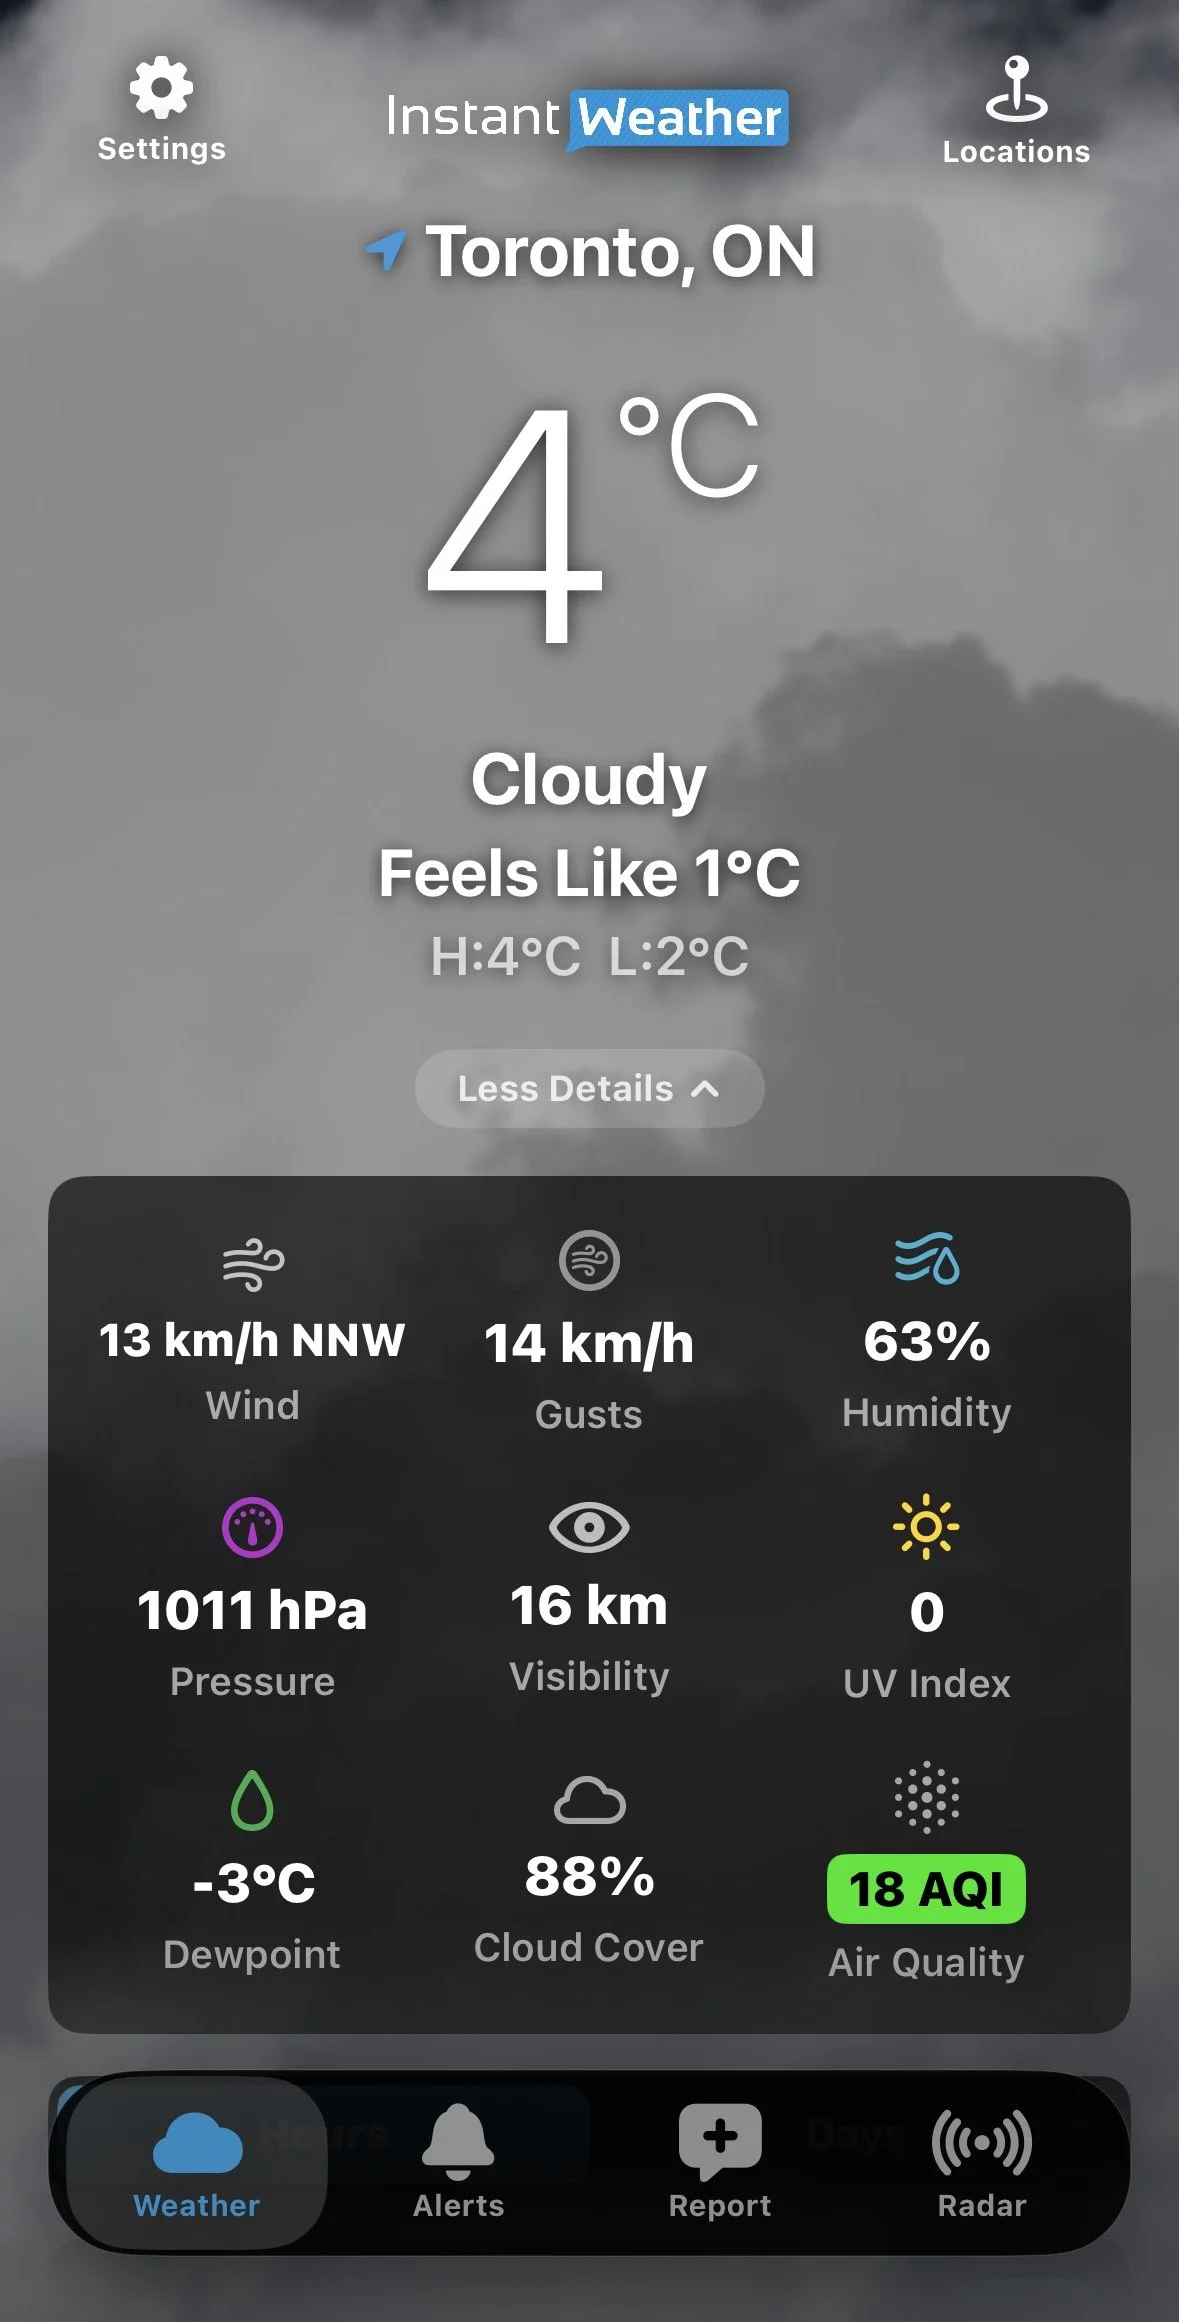
The Updated view displays the current temperature, conditions, feels-like temperature, and daily high and low near the top of the Weather page.

Select More Details to display additional current conditions, including:

  • Wind

  • Wind gusts

  • Humidity

  • Pressure

  • Visibility

  • UV Index

  • Dewpoint

  • Cloud cover

  • Air Quality Index (AQI)

Select Less Details to collapse this information again.

Tap the Air Quality Index (AQI) reading to see more information about current air quality, including the air quality rating, monitoring station, observation time, and pollutant concentrations. The AQI scale ranges from Good to Hazardous.
For more information about air quality readings, see our Air Quality (AQI) Now Available article.

Updated view with More Details expanded

Original Weather Page

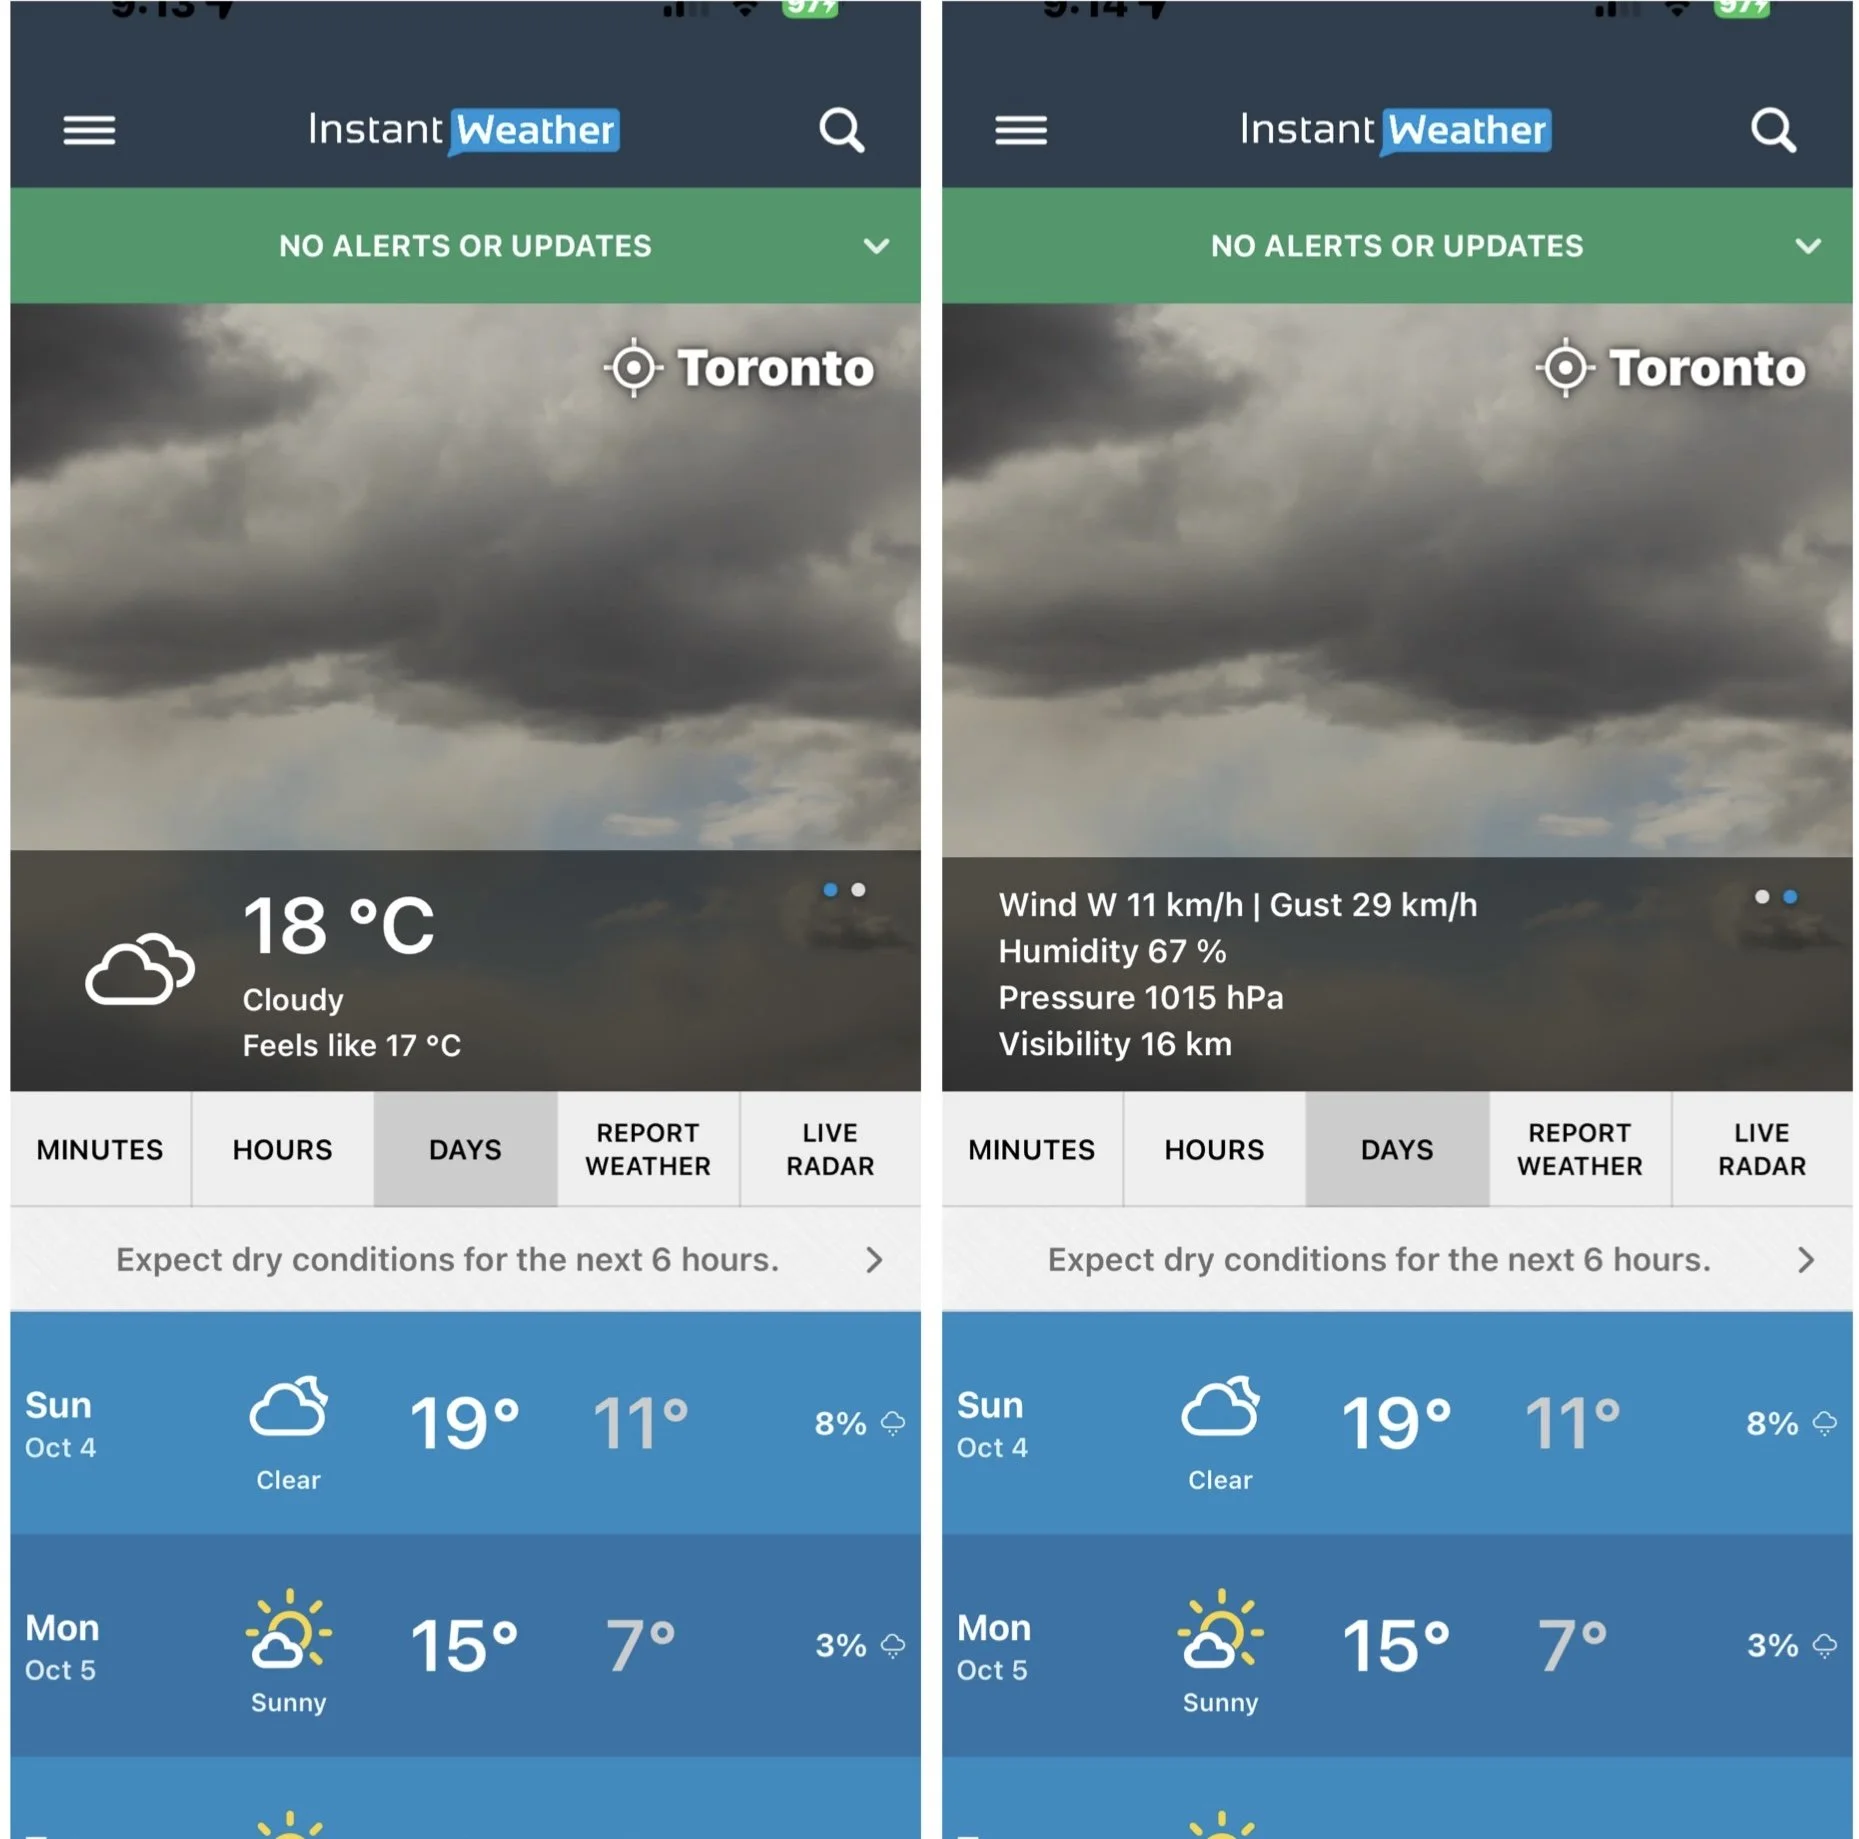
The Original view displays the current temperature, conditions and feels-like temperature over the weather background.

Additional current conditions are available by tapping the current conditions area. Tap the current conditions area to switch between the two sets of information.

Original current conditions / additional conditions

This lets you view information such as wind, wind gusts, humidity, pressure and visibility while retaining the Original Weather Page layout.

Hourly Forecast

Both Weather Page styles provide hourly forecast information, but the Updated view offers considerably more ways to explore it.

Updated Weather Page

Select Hours to view the hourly forecast.

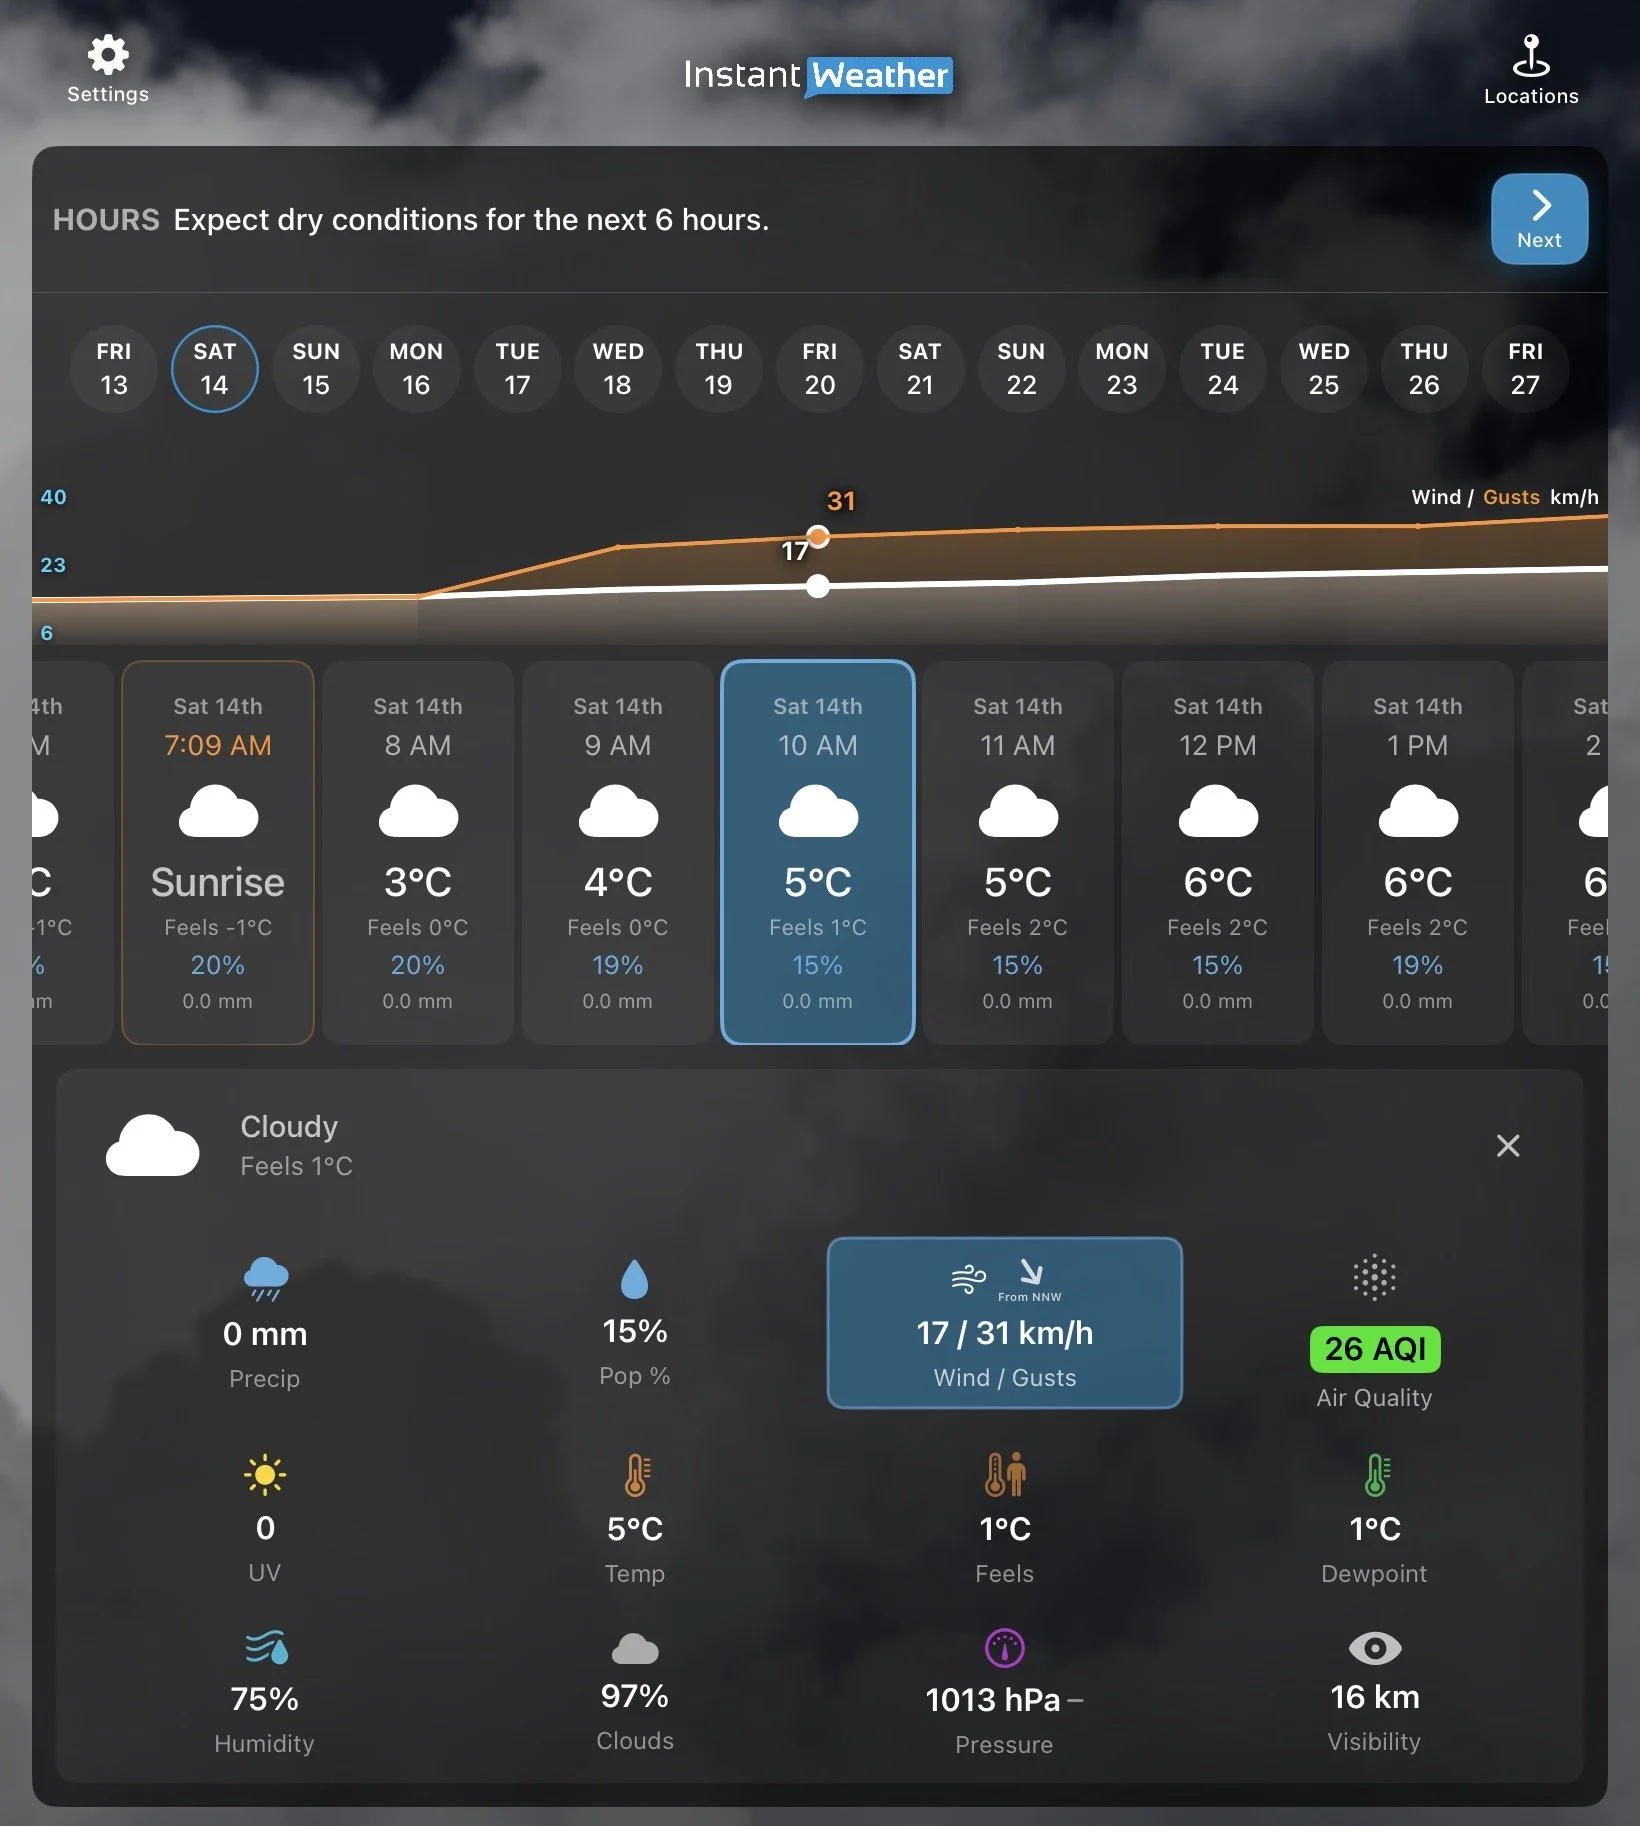
Each hour displays basic forecast information. Tap an hour or select Details and more products to open additional weather information for the selected hour, including:

  • Precipitation

  • Probability of precipitation

  • Wind/Wind gusts

  • Air Quality Index (AQI)

  • Temperature

  • Feels-like temperature

  • Dewpoint

  • Humidity

  • Cloud cover

  • Pressure

  • Visibility

The graph above the hourly forecast can display different weather values. Tap a measurement in the hourly details to select it. The selected measurement is highlighted in blue, and the graph updates to show how that value is expected to change over time.

For example, selecting Wind / Gusts displays wind speed as a white line and gusts as an orange line, allowing you to compare them throughout the forecast.

Selecting AQI displays the estimated Air Quality Index over time.

You can also select precipitation to see when rain or snow is expected to become heavier or lighter.

Updated hourly forecast with graph and detailed weather information

Finding the Next Precipitation

At the top of the Updated hourly forecast, the app provides a summary of expected precipitation.

If precipitation is expected later in the forecast, select Next to move ahead to the next period when precipitation is expected.

This can make it easier to find rain or snow that may not occur until several days later.

If no precipitation is expected in the immediate forecast, the app may instead display a message such as “Expect dry conditions for the next 6 hours.”

Original Weather Page

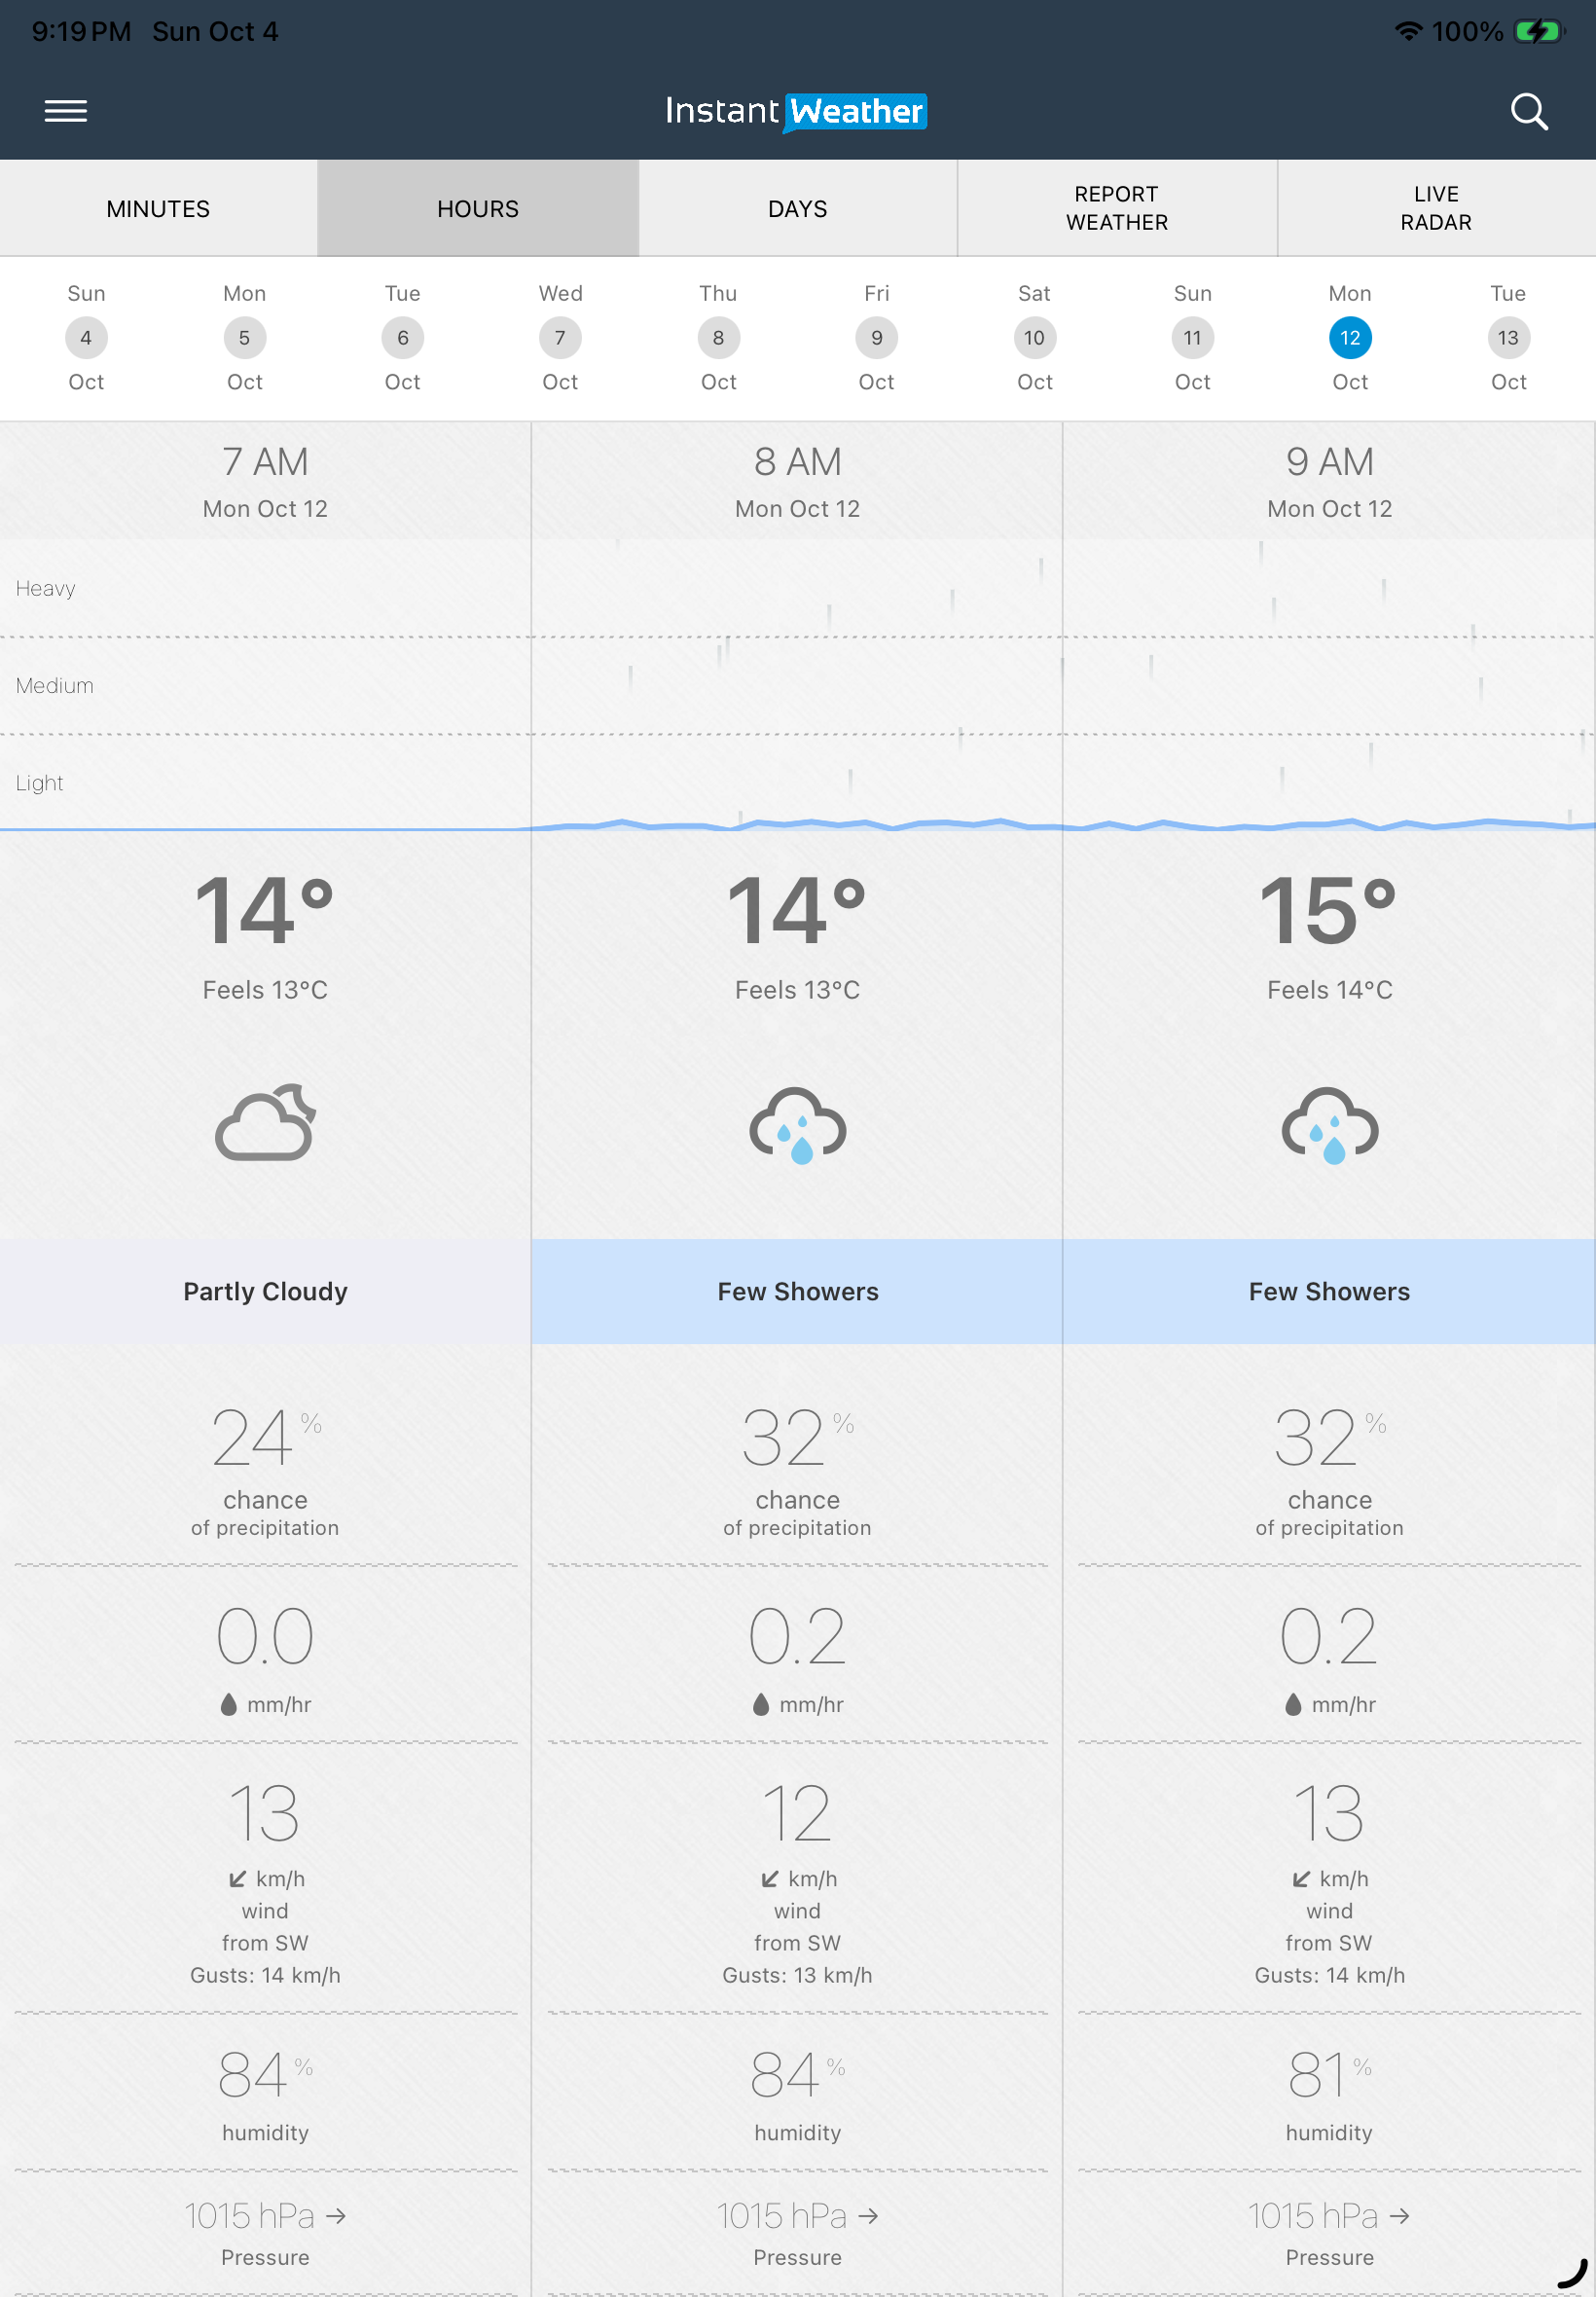
The Original view presents hourly forecast information in vertical columns.

You can scroll through the hours and dates to see information including temperature, feels-like temperature, weather conditions, chance and amount of precipitation, wind and gusts, humidity, and pressure.

Original hourly forecast

The Original view does not provide the same interactive graph that is available in the Updated view.

Daily Forecast

Both Weather Page styles allow you to select a day to see more detailed forecast information, including separate Day and Night forecasts, sunrise and sunset times, wind, precipitation information, and a link to view the hourly forecast.

The main difference is how the information is displayed. The Original style uses the familiar blue forecast cards, while the Updated style presents the forecast in a more compact list and separates longer-range forecasts into an Extended section.

Updated Weather Page

Select Days to see the daily forecast.

Each day shows the expected weather conditions, high and low temperatures, and precipitation information.

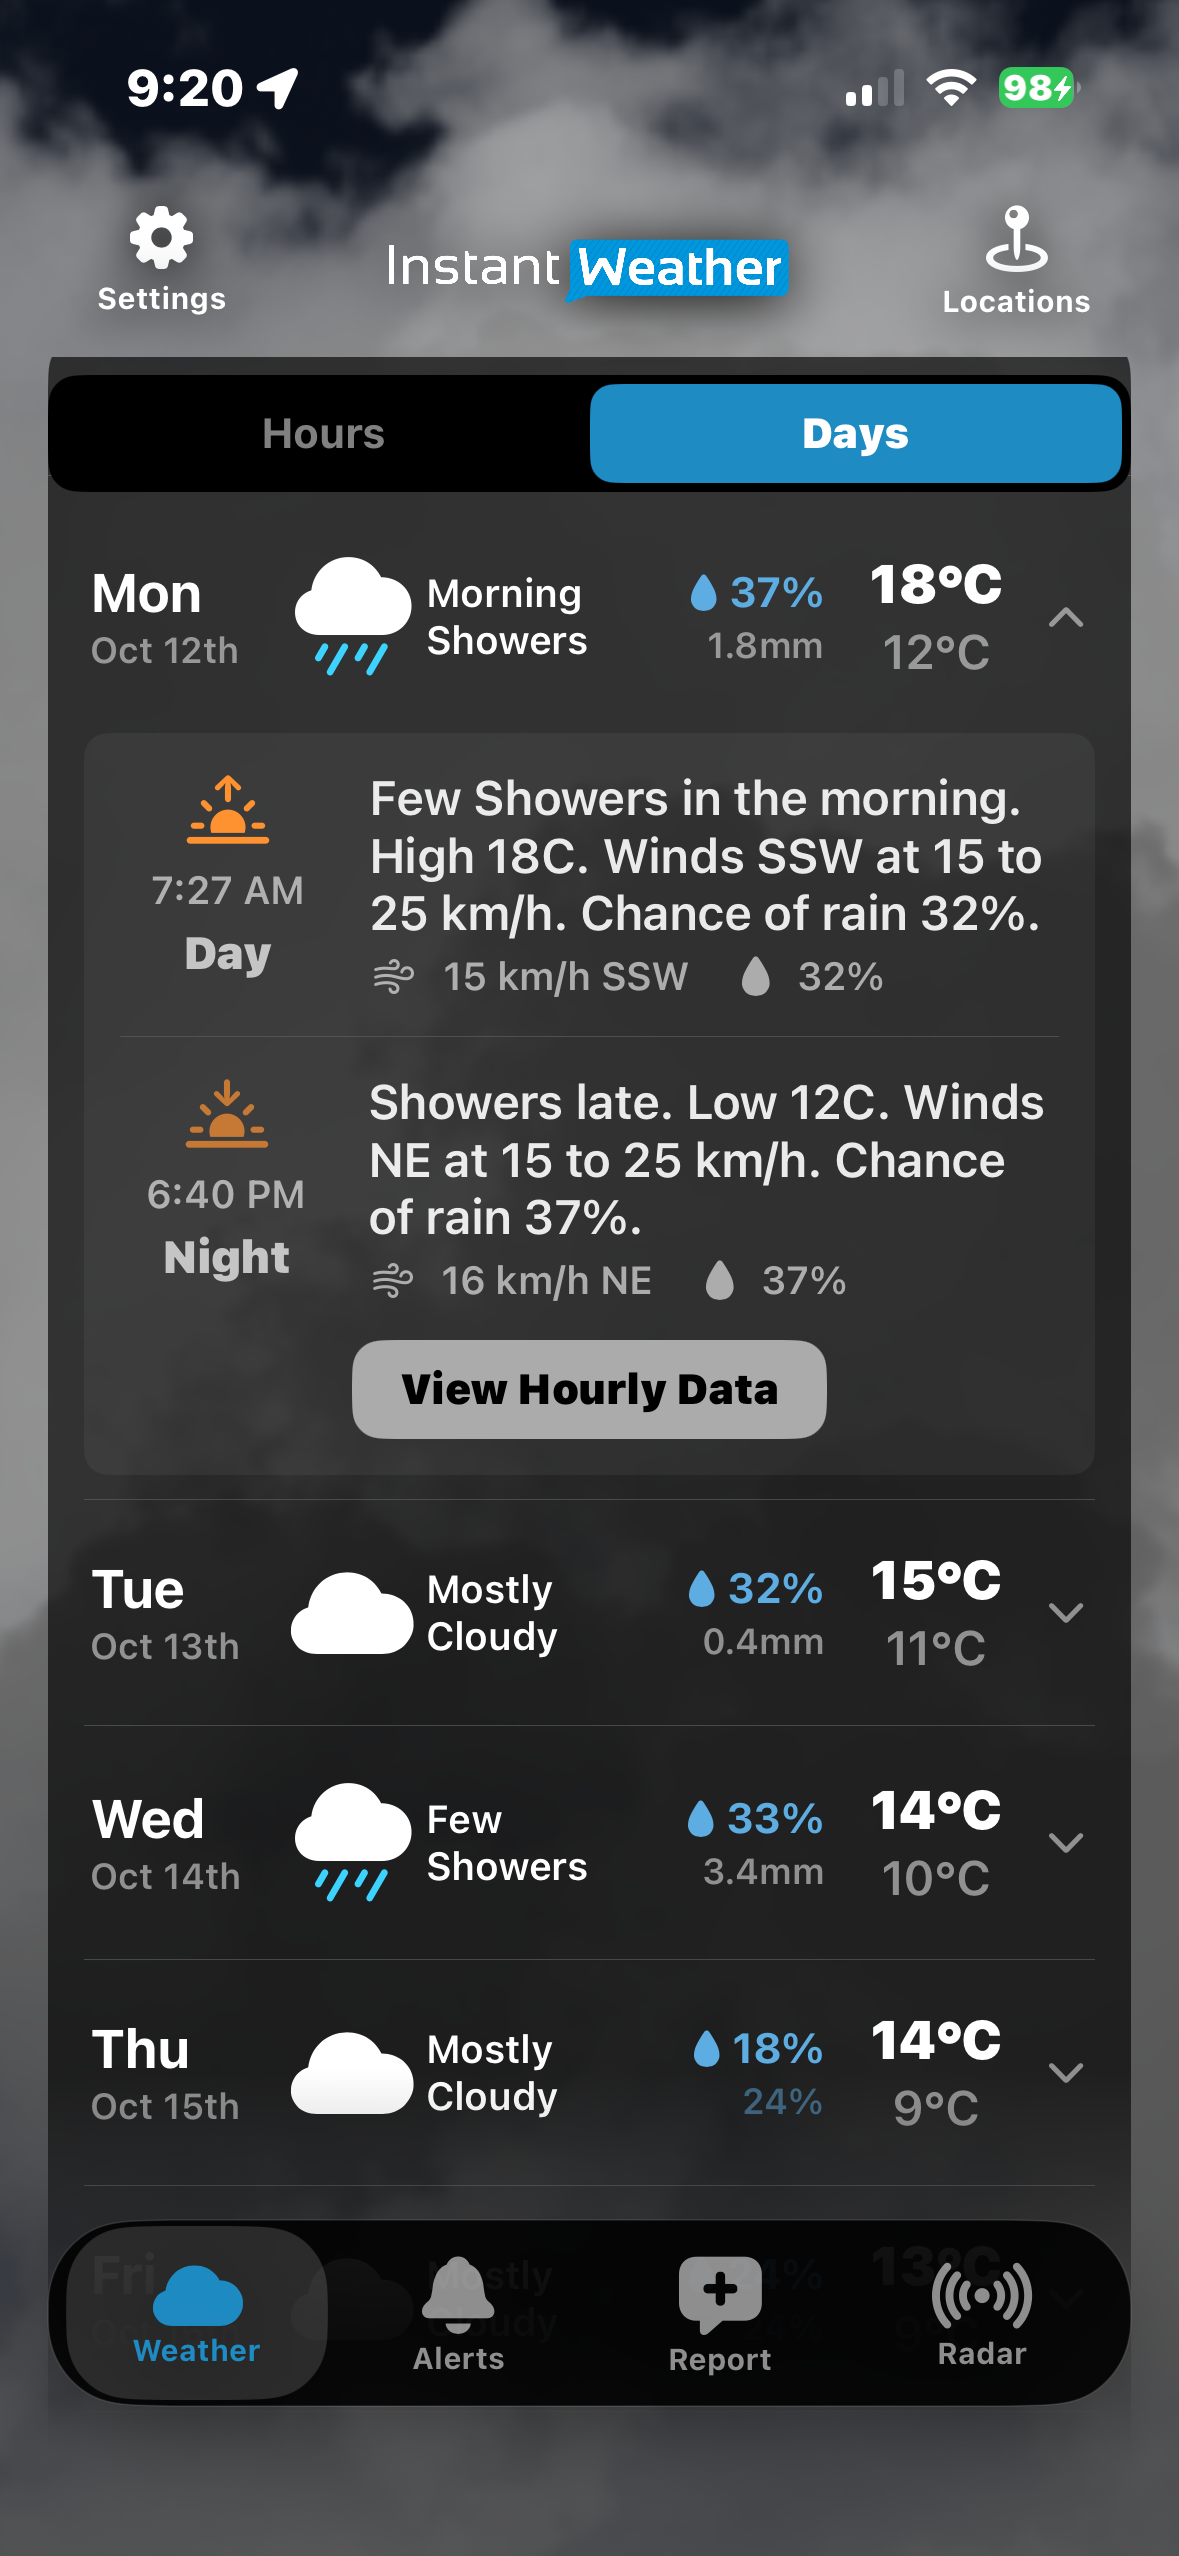
Tap the arrow beside a day to expand it.

The expanded forecast provides separate Day and Night information, including:

  • Forecast conditions

  • High or low temperature

  • Wind

  • Chance of precipitation

  • Sunrise and sunset times

You can also select View Hourly Data to view the hourly forecast for that day.

Updated Days view with a day expanded

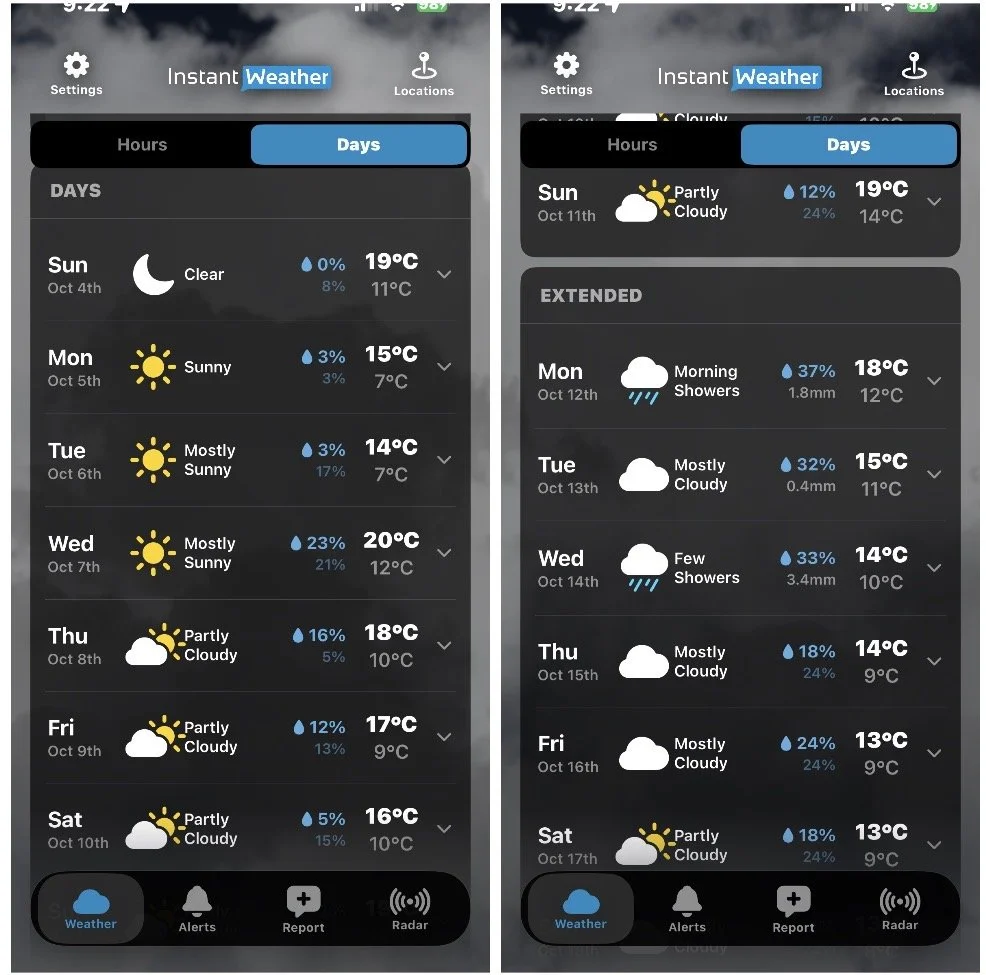
Forecasts farther into the future are displayed in a separate Extended section.

Updated Days and Extended forecasts

Original Weather Page

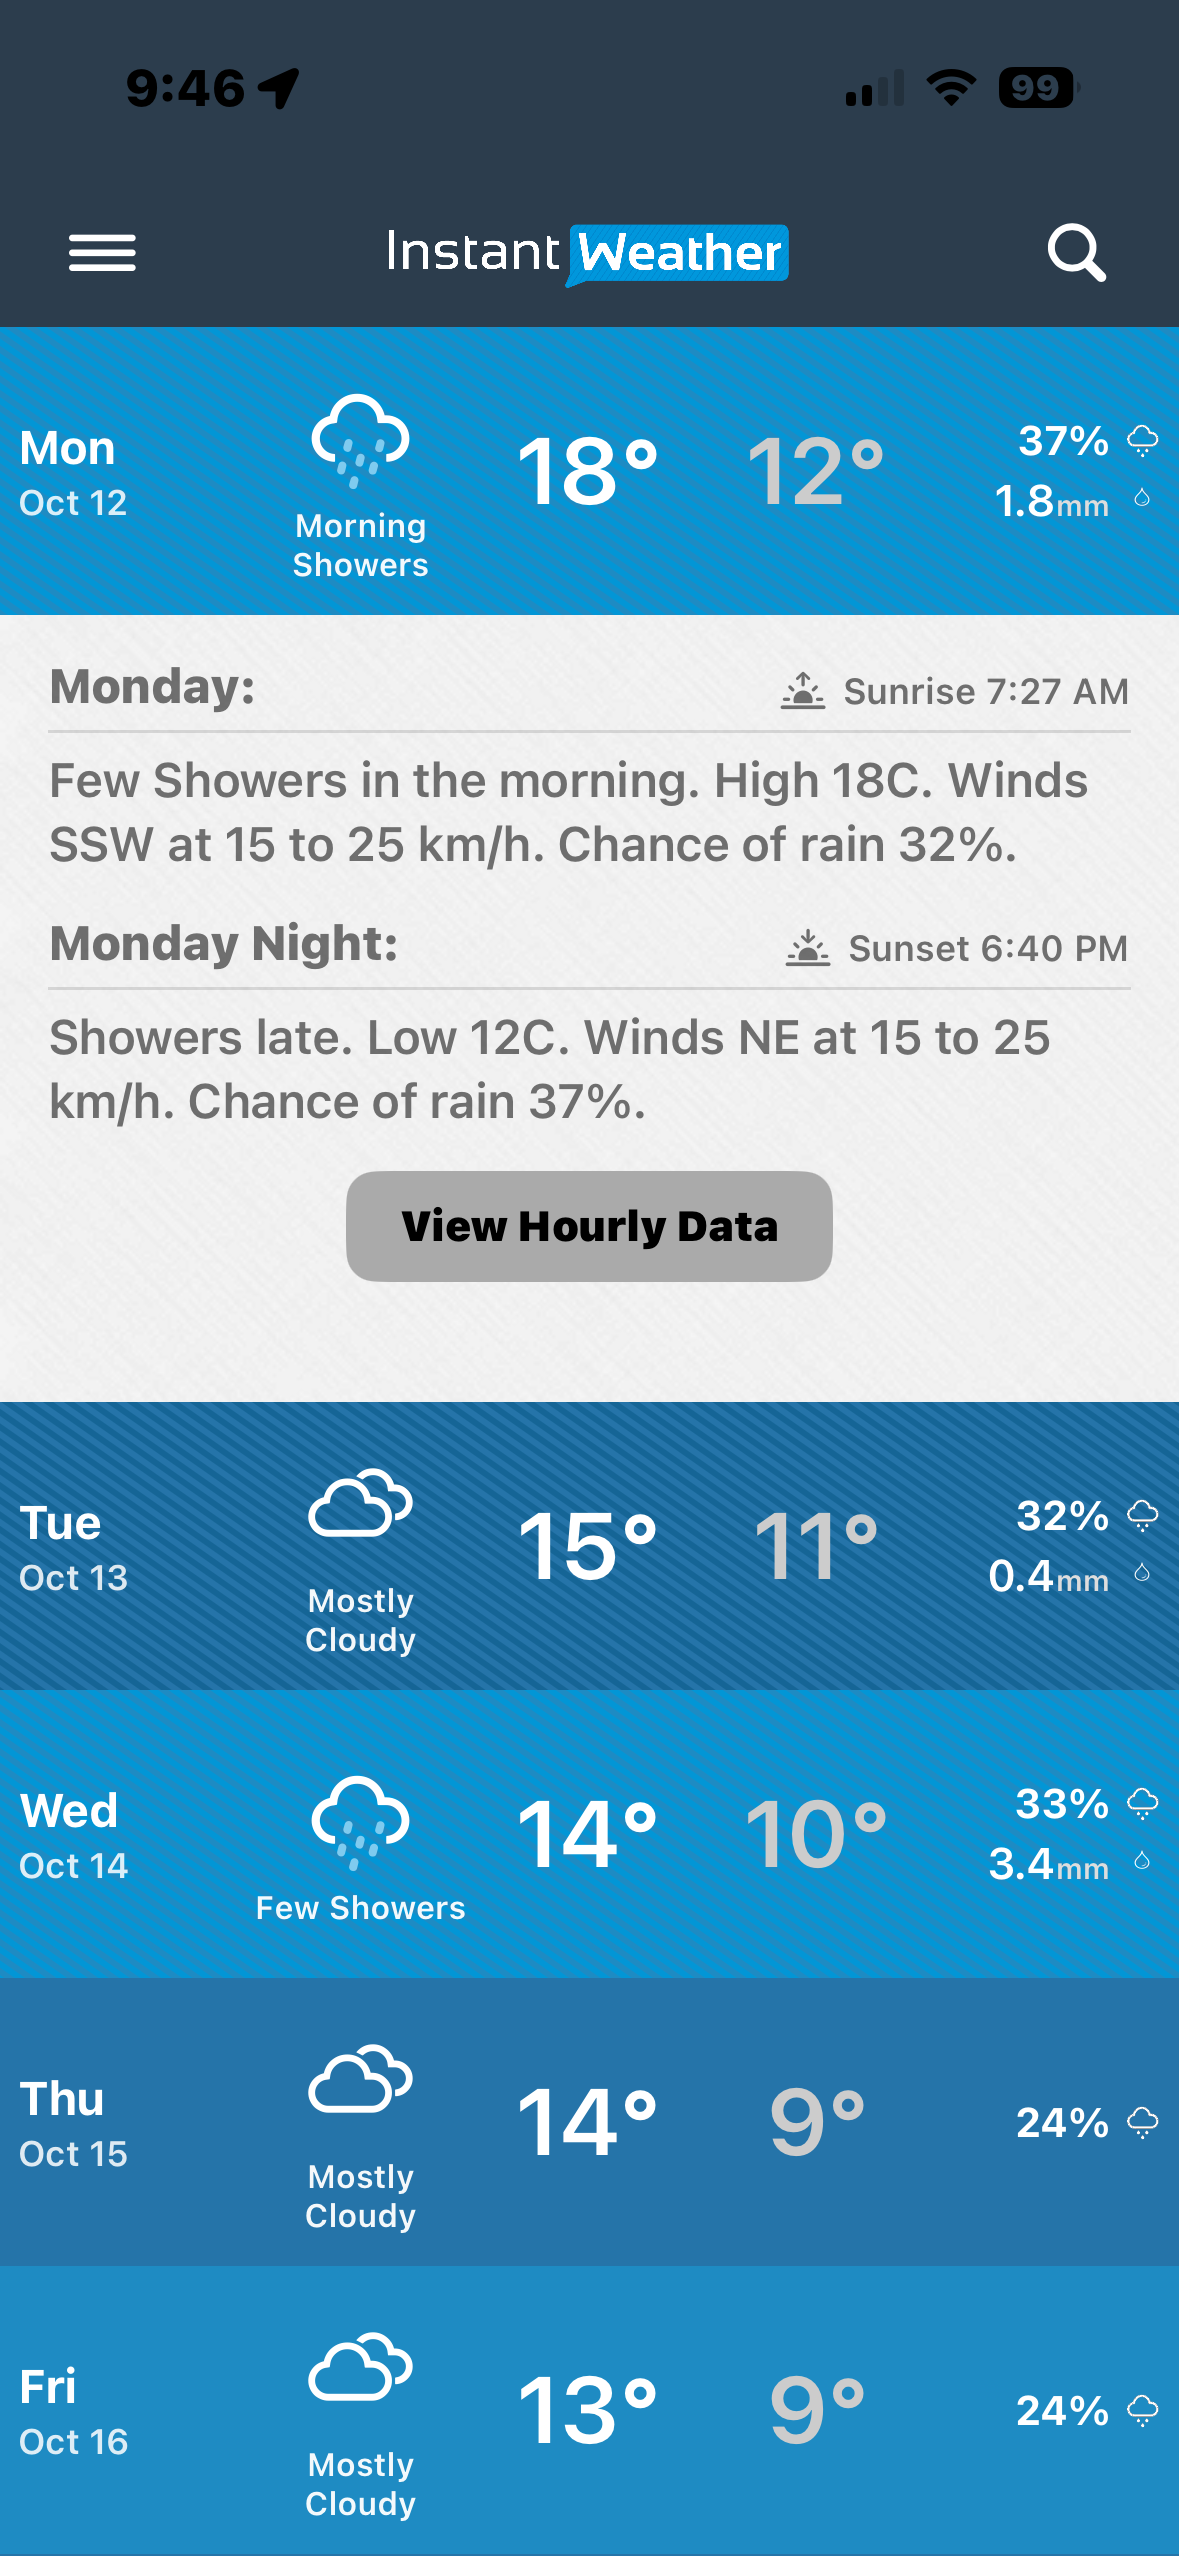
The Original Weather Page displays the daily forecasts as coloured rows.

Each row includes the date, expected conditions, high and low temperatures, and precipitation information.

When precipitation is forecast, the amount may also be displayed.

Original daily forecast

Select a day to view the detailed Day and Night forecasts, including sunrise and sunset times, forecast conditions, wind and precipitation information. You can also select View Hourly Data to see the hourly forecast for that day.

Which Weather Page Style Should I Use?

There is no right or wrong choice. Both styles provide access to your weather forecast.

You may prefer the Updated Weather Page if you want:

  • More current-condition details on one screen

  • A more interactive hourly forecast

  • Graphs showing how weather values change over time

  • Quick navigation to upcoming precipitation

  • Easier access to Extended forecasts

  • Access to current and forecast Air Quality Index (AQI) information

You may prefer the Original Weather Page if you:

  • Prefer the familiar Instant Weather layout

  • Like seeing the daily forecast in larger coloured rows

  • Prefer the traditional column-style hourly forecast

  • Want a simpler presentation of the forecast

You can switch between Updated and Original at any time under Settings → Weather Display → Weather Page Style.

Last updated: November 13, 2026

Back to Instant Weather Help Centre