Understanding Weather Fronts in IW Pro
/Have you noticed the coloured lines, triangles, semicircles and H and L symbols on the IW Pro radar?
The Weather Fronts feature adds information from traditional surface weather maps directly to the IW Pro radar. This can help you understand the larger weather pattern behind what you are seeing on radar, not just where rain or snow is occurring, but some of the atmospheric features helping to produce that weather.
Turning Weather Fronts On or Off
Weather Fronts can be enabled or disabled at any time.
Open Settings, expand the Weather Features section and use the Weather Fronts toggle to turn the layer on or off.
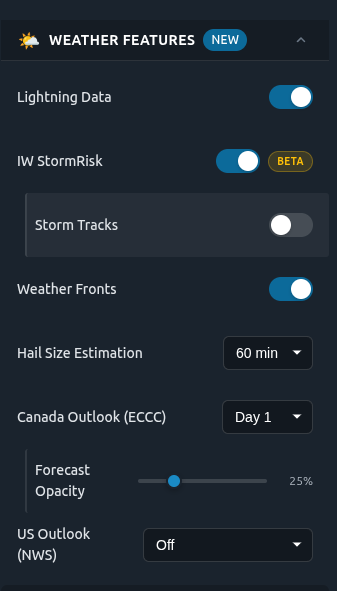
Once enabled the fronts and pressure systems will appear on the radar map.
Where Does the Weather Front Information Come From?
The fronts displayed in IW Pro are official fronts from the U.S. Weather Prediction Center (WPC).
The information is updated every three hours.
This is important to keep in mind when using the radar animation. The precipitation on the radar can move while the plotted weather fronts remain in the same position. The fronts are not currently animated continuously between WPC updates.
For example, if you play the radar loop, you might see an area of rain or thunderstorms moving eastward while a nearby cold front appears to remain stationary on the map. That doesn't necessarily mean the front itself isn't moving. It means that the position of the front shown on the map is based on the latest available WPC update.
We would eventually like to make this feature more dynamic by automatically moving the fronts between official updates using weather-station observations.
How to Read the Weather Fronts Map
The Weather Fronts layer uses the familiar symbols found on traditional surface weather maps. Understanding a few basic symbols can tell you quite a bit about the weather pattern.
🔵 Cold Front
A cold front is displayed as a blue line with blue triangles.
A cold front marks the leading edge of an advancing colder air mass. The triangles point in the direction the front is moving.
Cold fronts can be associated with showers and thunderstorms, particularly when warm and humid air is present ahead of the front. Temperatures and humidity often decrease following its passage.
🔴 Warm Front
A warm front is displayed as a red line with red semicircles.
It represents the leading edge of an advancing warmer air mass. The semicircles point in the direction the front is moving.
Warm fronts are often associated with increasing cloud cover and areas of precipitation ahead of the front, followed by warmer conditions after it passes.
🔴🔵 Stationary Front
A stationary front is shown using alternating red semicircles and blue triangles on opposite sides of the line.
This represents a boundary between two air masses that is moving very little or not at all.
Because a stationary front can remain over the same area for an extended period, it can sometimes contribute to prolonged cloud cover or precipitation.
🟣 Occluded Front
An occluded front is displayed as a purple line with alternating triangles and semicircles on the same side.
Occlusion occurs when a cold front catches up with a warm front. These systems are commonly associated with mature low-pressure systems and can produce widespread cloud and precipitation.
As with cold and warm fronts, the symbols point in the direction the front is moving.
High and Low Pressure Systems
Weather Fronts also lets you see the locations of high- and low-pressure systems.
🔵 H High Pressure
A blue H marks the centre of an area of relatively high atmospheric pressure.
High-pressure systems are often associated with quieter and clearer weather, although the actual conditions depend on the season and overall weather pattern.
🔴 L Low Pressure
A red L marks the centre of an area of relatively low atmospheric pressure.
Low-pressure systems are frequently associated with clouds, precipitation and more unsettled weather. Warm fronts, cold fronts and occluded fronts are commonly connected to low-pressure systems.
A pressure value may also be displayed near the H or L, indicating the atmospheric pressure near the centre of the system in millibars (mb).
What Are the Orange Lines?
You may also notice orange lines on the map.
These can represent troughs, which are elongated areas of relatively low atmospheric pressure.
Unlike a cold or warm front, a trough doesn't necessarily separate two distinct air masses. However, troughs can still be important areas for rising air, cloud development, precipitation and thunderstorms.
Putting It All Together
One of the advantages of displaying Weather Fronts on the IW Pro radar is being able to compare the larger weather pattern with what is actually happening on radar.
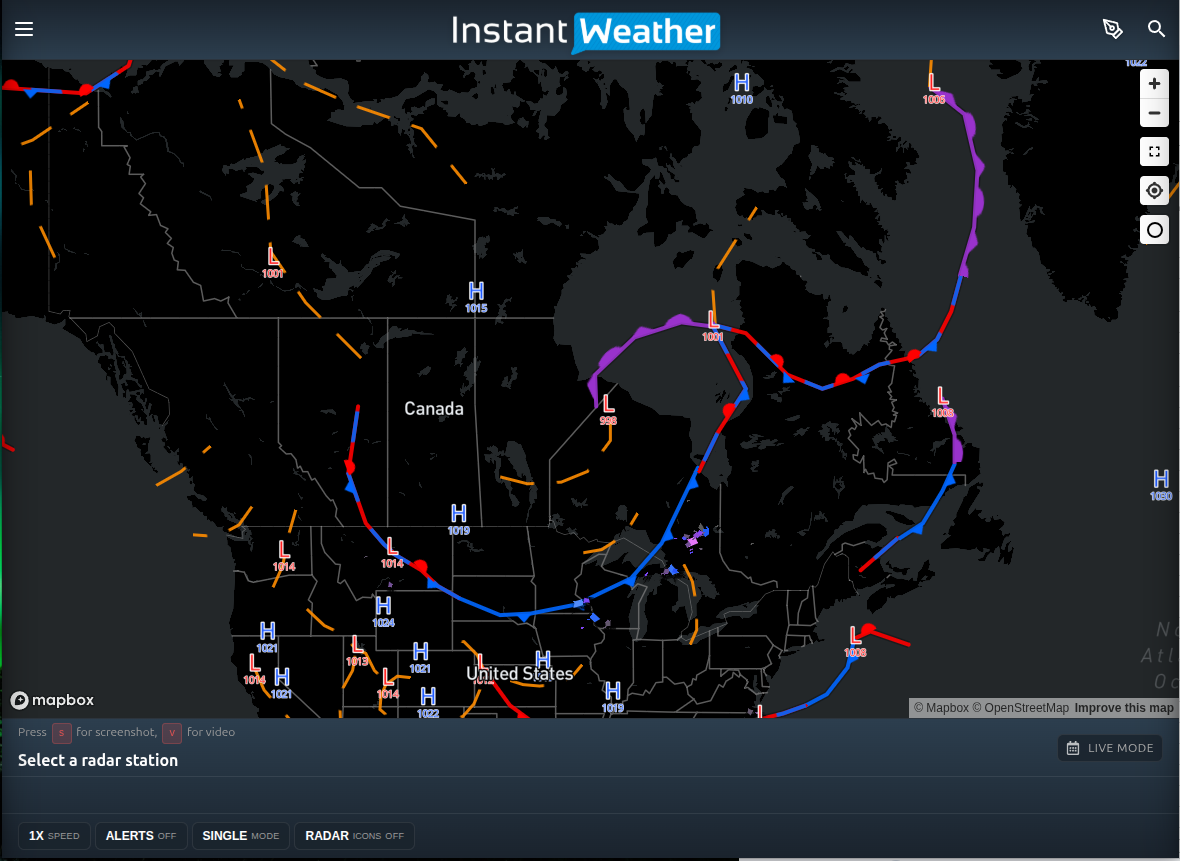
Weather Fronts in IW Pro
For example, you might be able to see:
a line of thunderstorms developing along or ahead of a cold front;
an area of steady precipitation associated with a warm front;
precipitation wrapping around a low-pressure system;
showers or thunderstorms developing near a trough; or
relatively quiet weather underneath an area of high pressure.
The radar shows you where precipitation is occurring, while the Weather Fronts layer provides additional information that can help explain why the weather pattern looks the way it does.
Combine Weather Fronts With Other IW Pro Layers
You can view Weather Fronts on a relatively uncluttered map by turning off other layers as above or combine them with other information available in IW Pro.
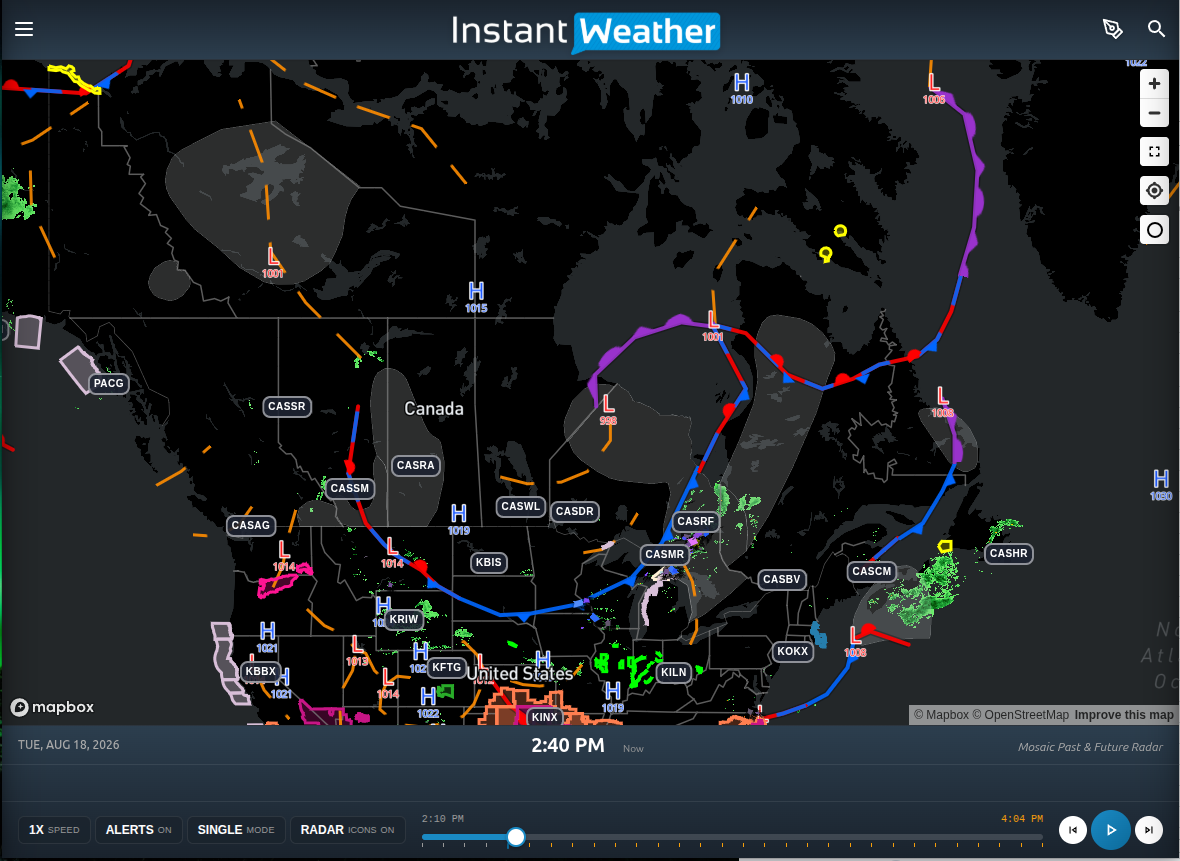
For example, you can display radar information, alerts and radar station information at the same time. Alternatively, turning some of those layers off can make it easier to focus specifically on the fronts and pressure systems.
Experiment with the different layers to find the combination that gives you the information you want without making the map too busy.
A Note About Timing
Because the fronts are updated every three hours rather than moving continuously, don't use their exact plotted position as a minute-by-minute indication of where a front is located.
The triangles and semicircles indicate the direction a front is moving, but the front itself will remain at its plotted position in IW Pro until updated information is received.
This is why you may occasionally notice that the precipitation has moved relative to a front while you are watching the radar.
Learn More About Weather Maps
For more information about fronts, pressure systems and the other symbols used on surface weather maps, NOAA's JetStream weather education site has a helpful guide.
https://www.noaa.gov/jetstream/wxmaps
Understanding these symbols can make the Weather Fronts layer in IW Pro much more useful and give you a better picture of what is happening in the atmosphere when you are watching weather develop on radar.
-
Examples
- Jul 8, 2026 Spotting Outflow Boundaries in IW Pro Jul 8, 2026
- Jul 23, 2023 Hail spike example Jul 23, 2023
- Jul 22, 2023 Example of bow echo-type storm with counter-rotating vortices Jul 22, 2023
-
Features
- Aug 18, 2026 Understanding Weather Fronts in IW Pro Aug 18, 2026
- Jun 27, 2026 Understanding Storm Relative Velocity (SRV) in IW Pro Jun 27, 2026
- Mar 23, 2026 Weather Alerts in IW Pro: More Control Than Ever Mar 23, 2026
- Mar 23, 2026 Canadian Radar Outages Now Available in IW Pro Mar 23, 2026
- Feb 28, 2025 🛠️ IW Pro Settings Overview (last reviewed May 2025) Feb 28, 2025
- Feb 28, 2025 Environment Canada's "Thunderstorm Outlooks" Feb 28, 2025
- Aug 26, 2024 Listing and full description of alerts Aug 26, 2024
- Aug 26, 2024 IW StormRisk storm track arrows and colour key Aug 26, 2024
- Jul 30, 2024 IW StormRisk is live Jul 30, 2024
- Jul 10, 2024 U.S. alerts Jul 10, 2024
- Jul 10, 2024 Mosaic Radar Layer Jul 10, 2024
- Jul 10, 2024 IW StormRisk preview Jul 10, 2024
- Sep 9, 2023 Measurement tool in single mode Sep 9, 2023
- Jul 24, 2023 🛠️ Requested Features (Updated May 2025) Jul 24, 2023
- Jul 17, 2023 Canadian Alerts Jul 17, 2023
-
Getting Started
- Jul 9, 2026 Getting Started with IW Pro Jul 9, 2026
- May 20, 2025 Introduction to Instant Weather Pro May 20, 2025
- Jul 23, 2023 White screen on mobile - Update Aug 15 Jul 23, 2023
-
How-to
- Mar 23, 2026 How to Update the Credit Card Linked to Your IW Pro or TMA Subscription Mar 23, 2026
- Sep 6, 2023 Adding IW Pro to your Home Screen Sep 6, 2023
- Jul 22, 2023 How to read radar Jul 22, 2023
- Jul 22, 2023 Live Mode vs Regular Mode vs Historical Mode Jul 22, 2023
-
News
- Mar 23, 2026 Weather Alerts in IW Pro: More Control Than Ever Mar 23, 2026
- Mar 23, 2026 Canadian Radar Outages Now Available in IW Pro Mar 23, 2026
- Sep 9, 2023 Measurement tool in single mode Sep 9, 2023
- Sep 9, 2023 Improved experience for Android mobile users Sep 9, 2023
- Sep 6, 2023 Recent Improvements as of Sept 6 Sep 6, 2023
-
Resources
- Jun 24, 2025 🌪️ Tornadoes, Downbursts, and Microbursts: What’s the Difference and How to Spot Them on Radar Jun 24, 2025
- Jul 24, 2023 The Anatomy of the Life of a Supercell Jul 24, 2023
-
Troubleshooting
- Sep 9, 2023 Improved experience for Android mobile users Sep 9, 2023
- Sep 6, 2023 Adding IW Pro to your Home Screen Sep 6, 2023
- Jul 24, 2023 Tip for map on mobile devices Jul 24, 2023
- Jul 23, 2023 White screen on mobile - Update Aug 15 Jul 23, 2023